Leverage Google Maps Air Quality API with Mapify
November 28, 2023
Mário Sobral

Google has recently released its Google Maps Environment-focused APIs, which include the Air Quality, Polen, and Solar APIs. This article provides guidance on how Mapify can help you leverage the Air Quality API without requiring any code.
To invoke Google Maps APIs, you will need to provide a Google Maps API key. You can obtain it by creating a GCP project (if you don't have one yet) and then generating an API key with the necessary permissions.
Google Maps Air Quality API
The Air Quality API lets you request air quality data for a specific location, including over 70 air quality indexes (AQIs), pollutants, and health recommendations. It covers over 100 countries with a resolution of 500 x 500 meters. Check the Air Quality API overview guide here.
This API provides endpoints that let you query:
- Current Conditions: Real-time hourly air quality information.
- Hourly History: Air quality history for a specific location, for a given time range, up to a maximum of 30 days.
- Heatmaps: Color coded tiles of various indexes and pollutants.
This article focuses on the Current Conditions endpoint.
Use Mapify to empower your solutions with Air Quality API information
There are two possible approaches to leveraging the Air Quality API using Mapify:
- Data Feed
- Workflow node
If you have a set of predefined locations for which you want regular updates on air quality, main pollutants, and recommendations—and you want to apply your business rules—you can create a Data Feed to regularly call the API and provide the resulting data to the associated Workflows.

If you need the result of a Google Maps Environment API to process a specific business rule inside a Workflow, or you require the request to include parameters from your sensor data, you can use an HTTP Response transformer node.

Regardless of the approach you use, the result of calling the Air Quality API will include an array of indexes (you will need at least one), but it can also include more detailed information such as the list of measured pollutants and health recommendations. In order for the API to return additional information beyond the indexes, you should include their respective parameter in the request.
Since there are many pollutants that can affect air quality, indexes exist to associate certain measured levels of different pollutants to a calculated value that should represent the overall air quality for that combination of pollutant levels.
The pollutants list provides you with a detailed view of the measured levels for each pollutant, allowing you to make your own calculations and use its values in your business rules regarding each pollutant.
Health recommendations provide general protective health guidelines to different groups of people according to the measured air quality.
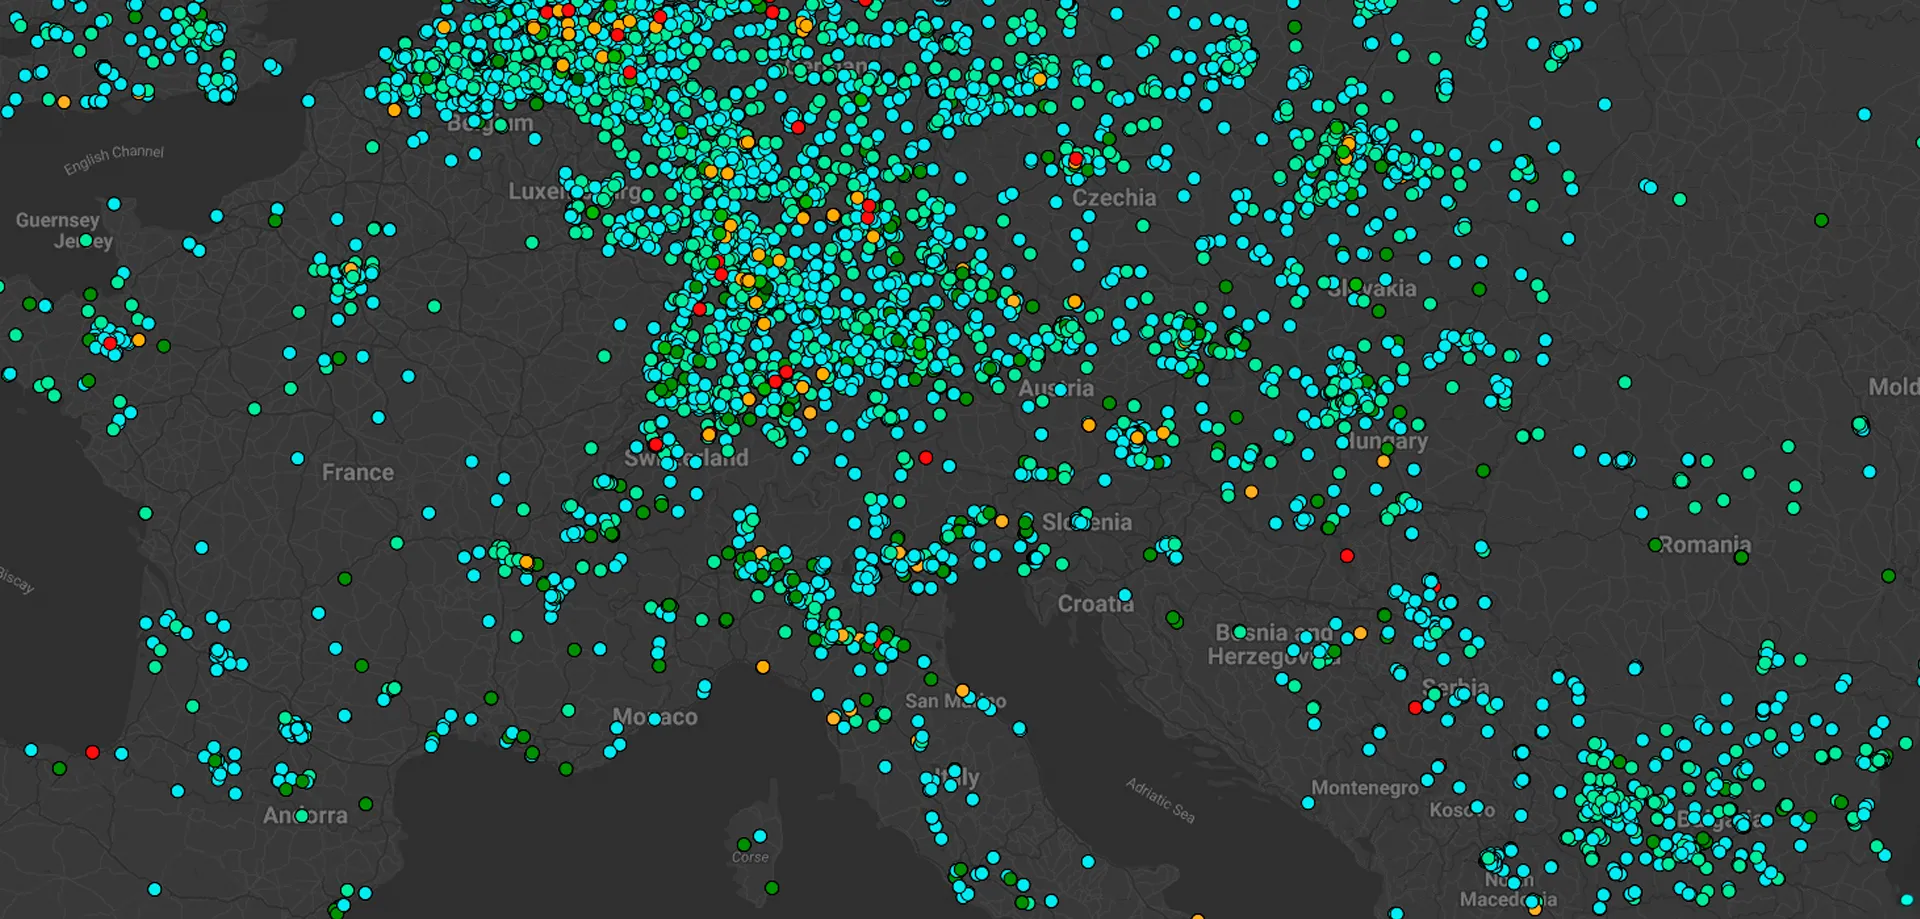
Once you obtain data from the Air Quality API through your Data Feed and/or Workflow node, such as the current conditions, you can update a Dataset and render the information through a real time Layer. This allows you to have a up to date visualization of the air quality in all your provided locations.

Start your free trial today, experiment hands-on with the Air Quality, Pollen, and Solar APIs, and unlock a new realm of possibilities for your projects.

.jpg)

.webp)