6 Easy steps to display your real-time data on a map using Mapify
January 12, 2023
Mário Sobral
Maybe you're building the next Uber and want to display the nearest drivers accessible, or you implemented a mesh of IoT sensors in a factory and want to have a real-time view of their current status, or you have built the perfect solution for parking or charging electric vehicles and want your users to find the nearest one available quickly.
In all these scenarios, it is crucial to display location-based data on a map, updating in real-time. We're guessing you already have a REST API returning the data you want to render on the map, so it should be easy. But, most often than not, you end up writing and debugging thousands of lines of code and losing valuable time instead of simply focusing on your core business.
With Mapify, you can easily consume the REST API data and display it as real-time layers over Google Maps for perfect location context.
👉 Takes only a few minutes
👉 Doesn't require coding
👉 Allows dynamic styling of your layers
👉 Filters out unwanted data
Mapify will handle incoming real-time sensor data, process it through a simplified workflow and display it over Google Maps in a web application.
These are the 6 simple steps you have to follow
- Create a Dataset to hold the incoming data
- Create a Data Feed to invoke your API and get the data
- Create a Workflow to save the incoming data to the Dataset
- Create a real-time Layer to display your data
- Create a Map with your layers
- Generate a shareable Mapify Web App for your users
If you don't know what any of these terms mean, check out our Mapify Documentation.
In this example let's assume we want to build a visualization of all the trains in Finland, as they travel across the country, updating their position regularly on the map. Digitraffic.fi has a set of public REST APIs, with one of its endpoints allowing us to obtain the latest position of each train.
1. Create a Dataset to hold the incoming data
Our first step will be to create a Dataset that will hold the latest positions of each train, with some fields for holding data from the responses of the API. For simplicity, we'll just add a few fields, making sure one of the fields will hold a unique value for each train. In this case, it will be train_number.

2. Create a Data Feed to invoke your API and get the data
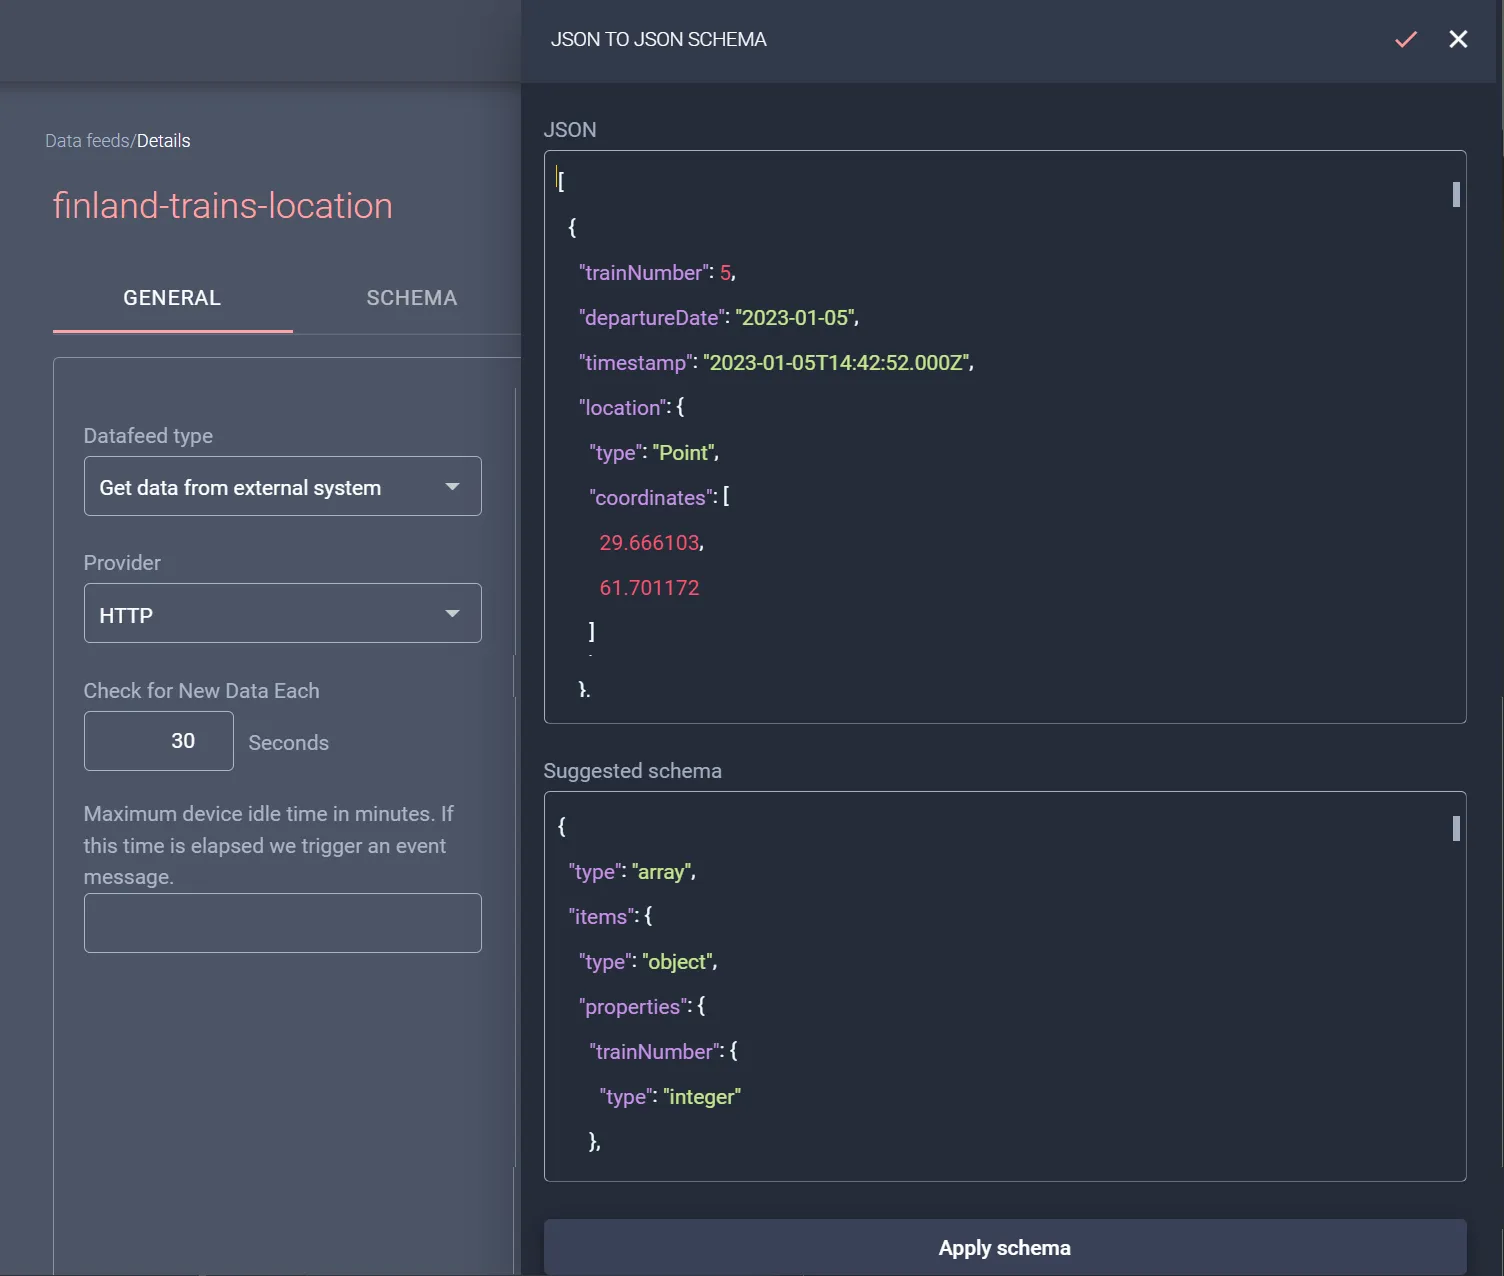
The next step is to create a Data Feed, configuring it to regularly invoke the API endpoint in order to obtain the latest position of each train. In the Data Feed details screen, we just configure the HTTP request URL, the regularity (we used 30 seconds in this case, but it's up to you to set up the best interval for your specific business needs ), and the schema of the incoming messages.
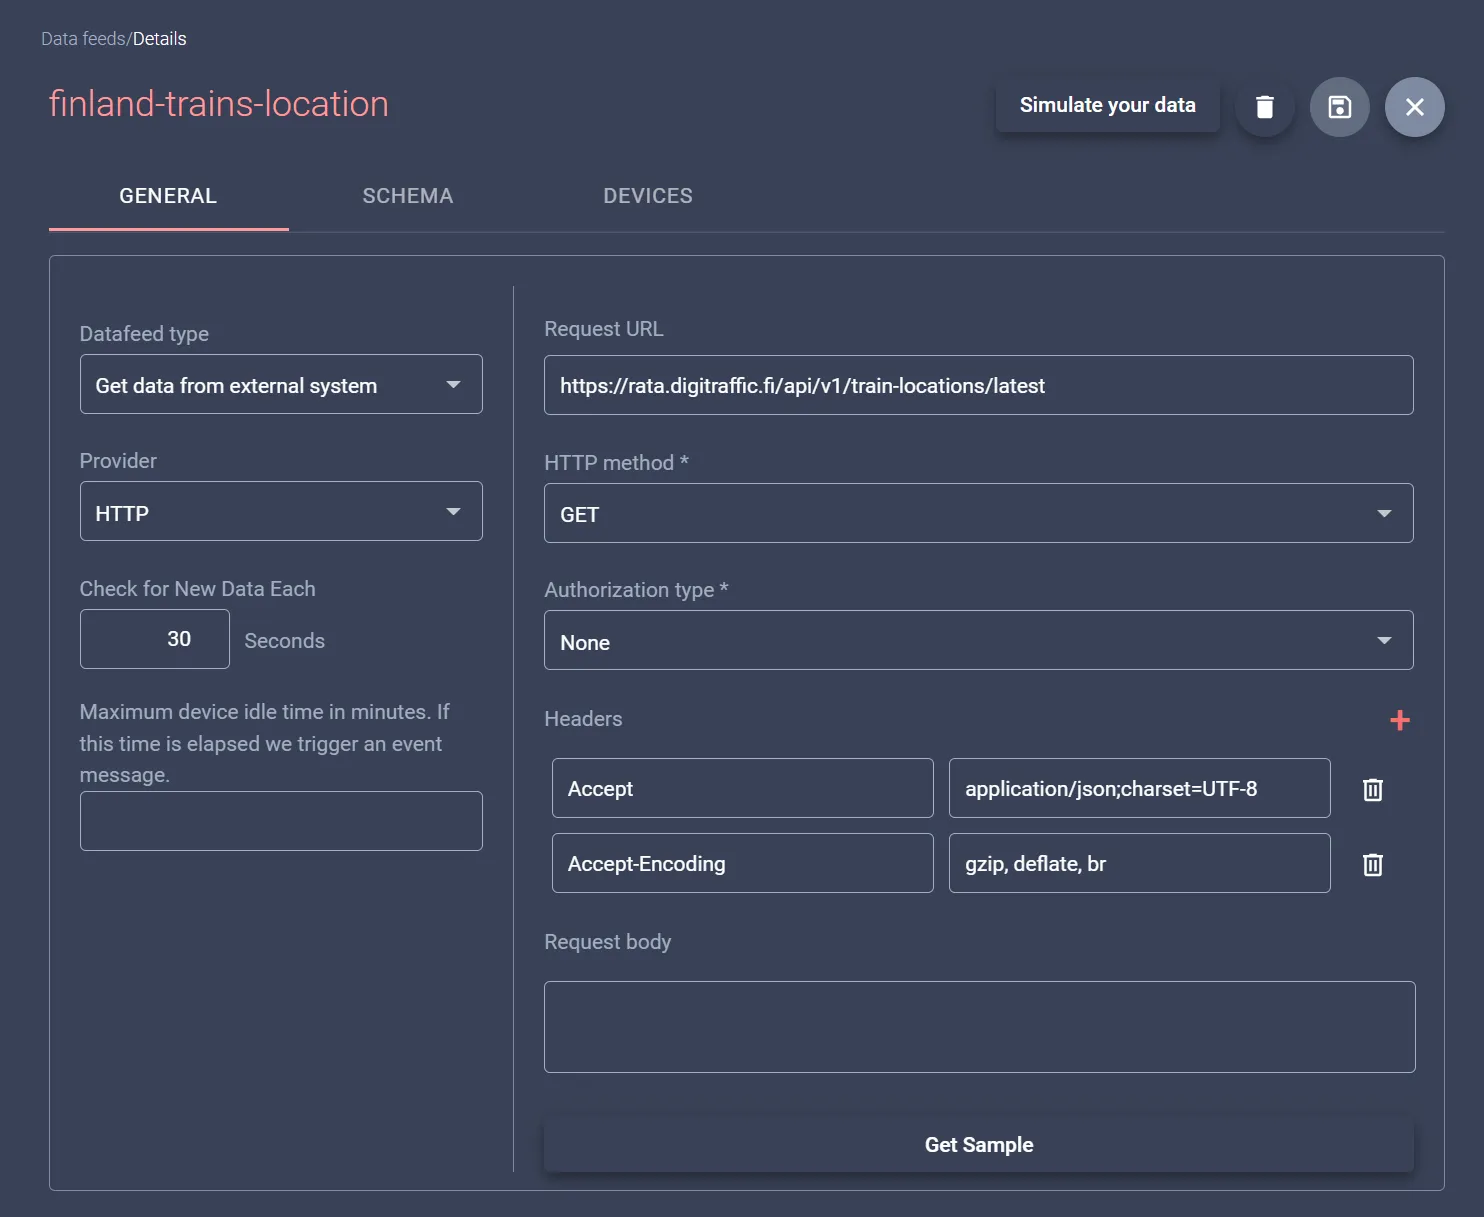
Mapify can even generate the incoming message schema for you, using a sample request from the configured endpoint. And all it takes is a couple of button clicks.
3. Create a Workflow to save the incoming data to the Dataset
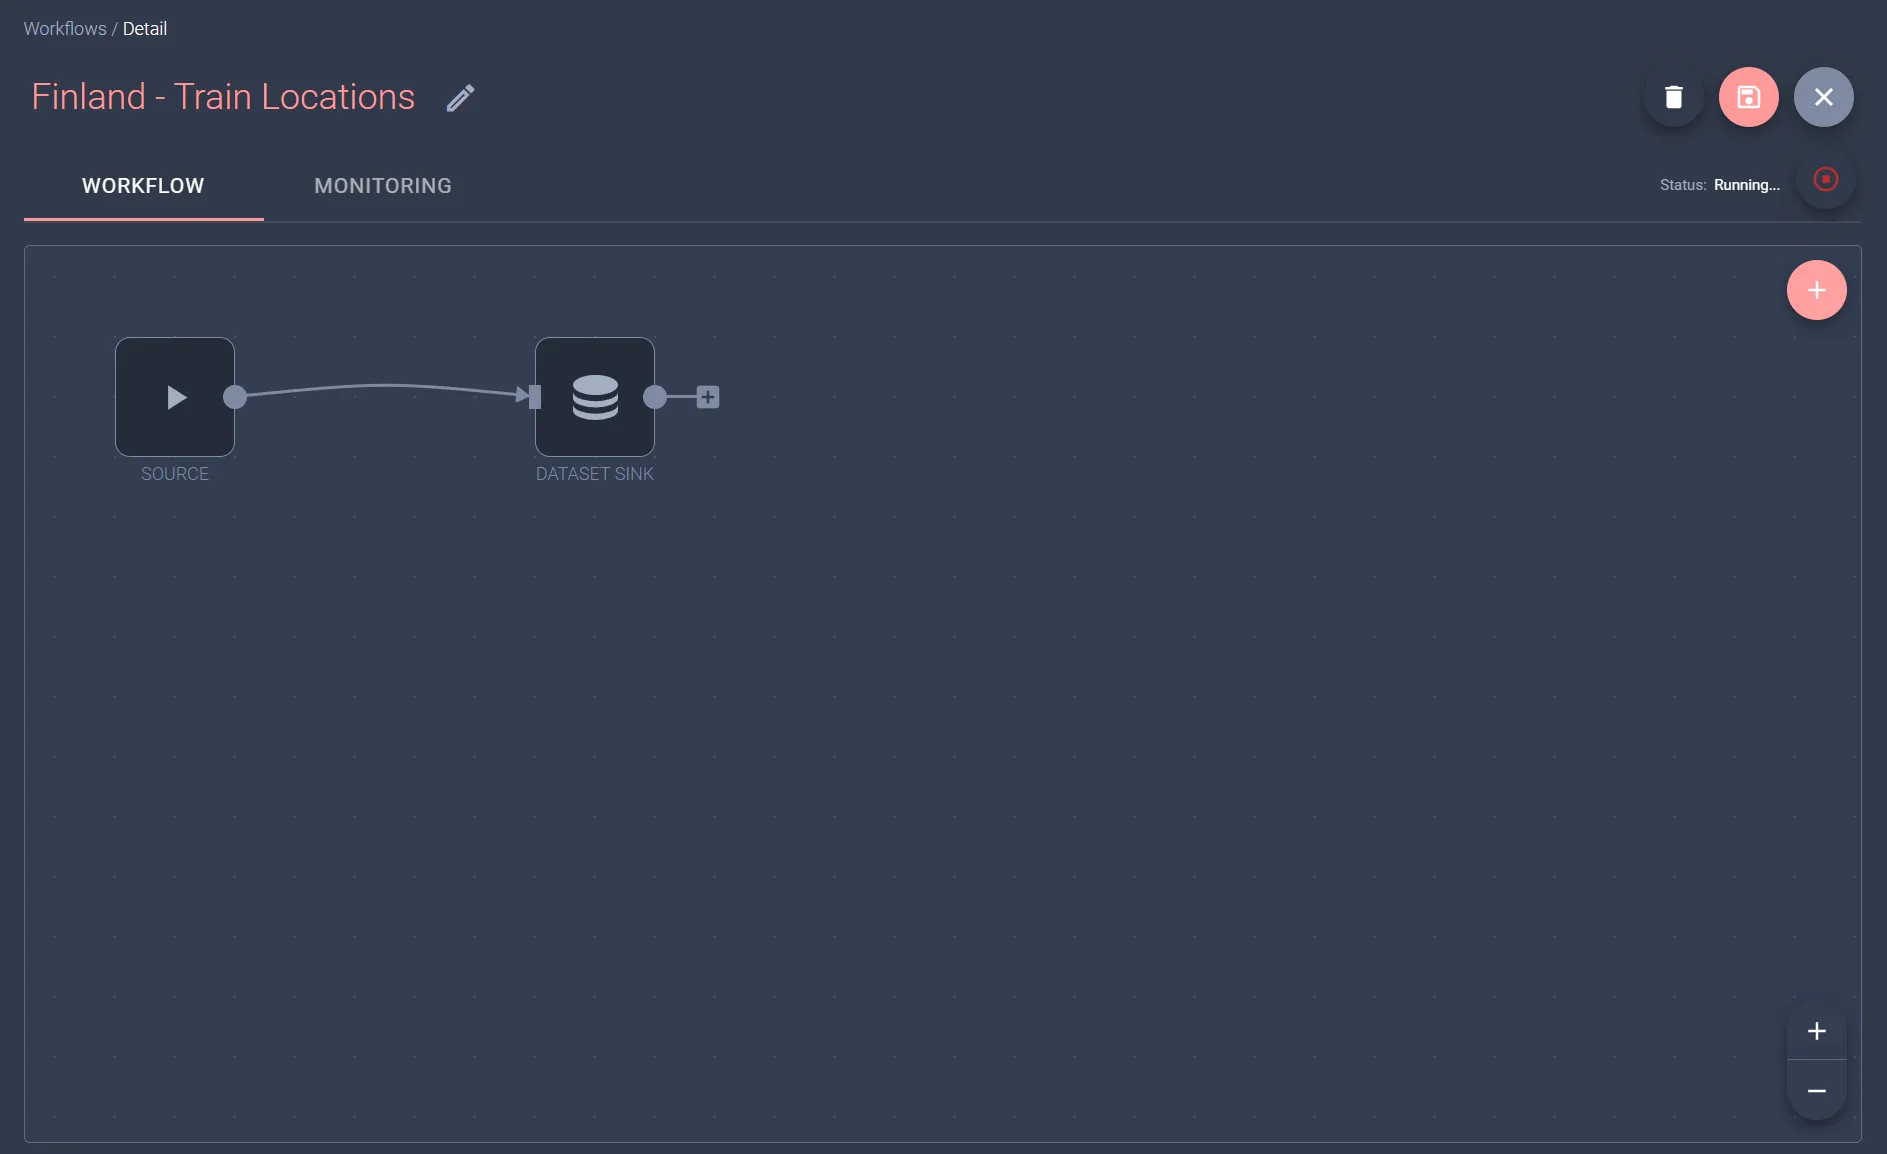
The third step is about saving the incoming data into the previously created train locations Dataset. You can use a simple Workflow which uses the Data Feed as its source of data and add a Sink node to update data in the Dataset. Just map the message fields to the Dataset fields, and Mapify will do the rest for you.
Once the workflow starts running, all the data obtained through your Data Feed will be processed by the Workflow, and saved in the Dataset.
4. Create a real-time Layer to display your data
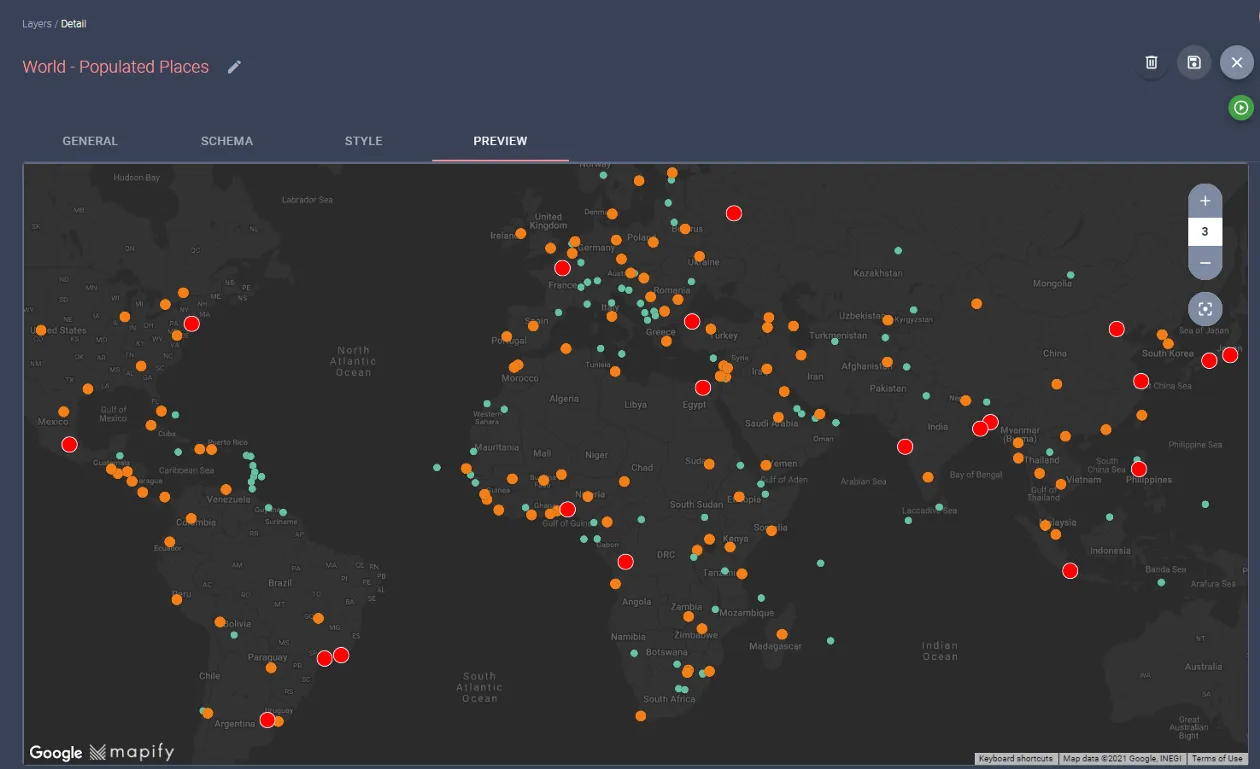
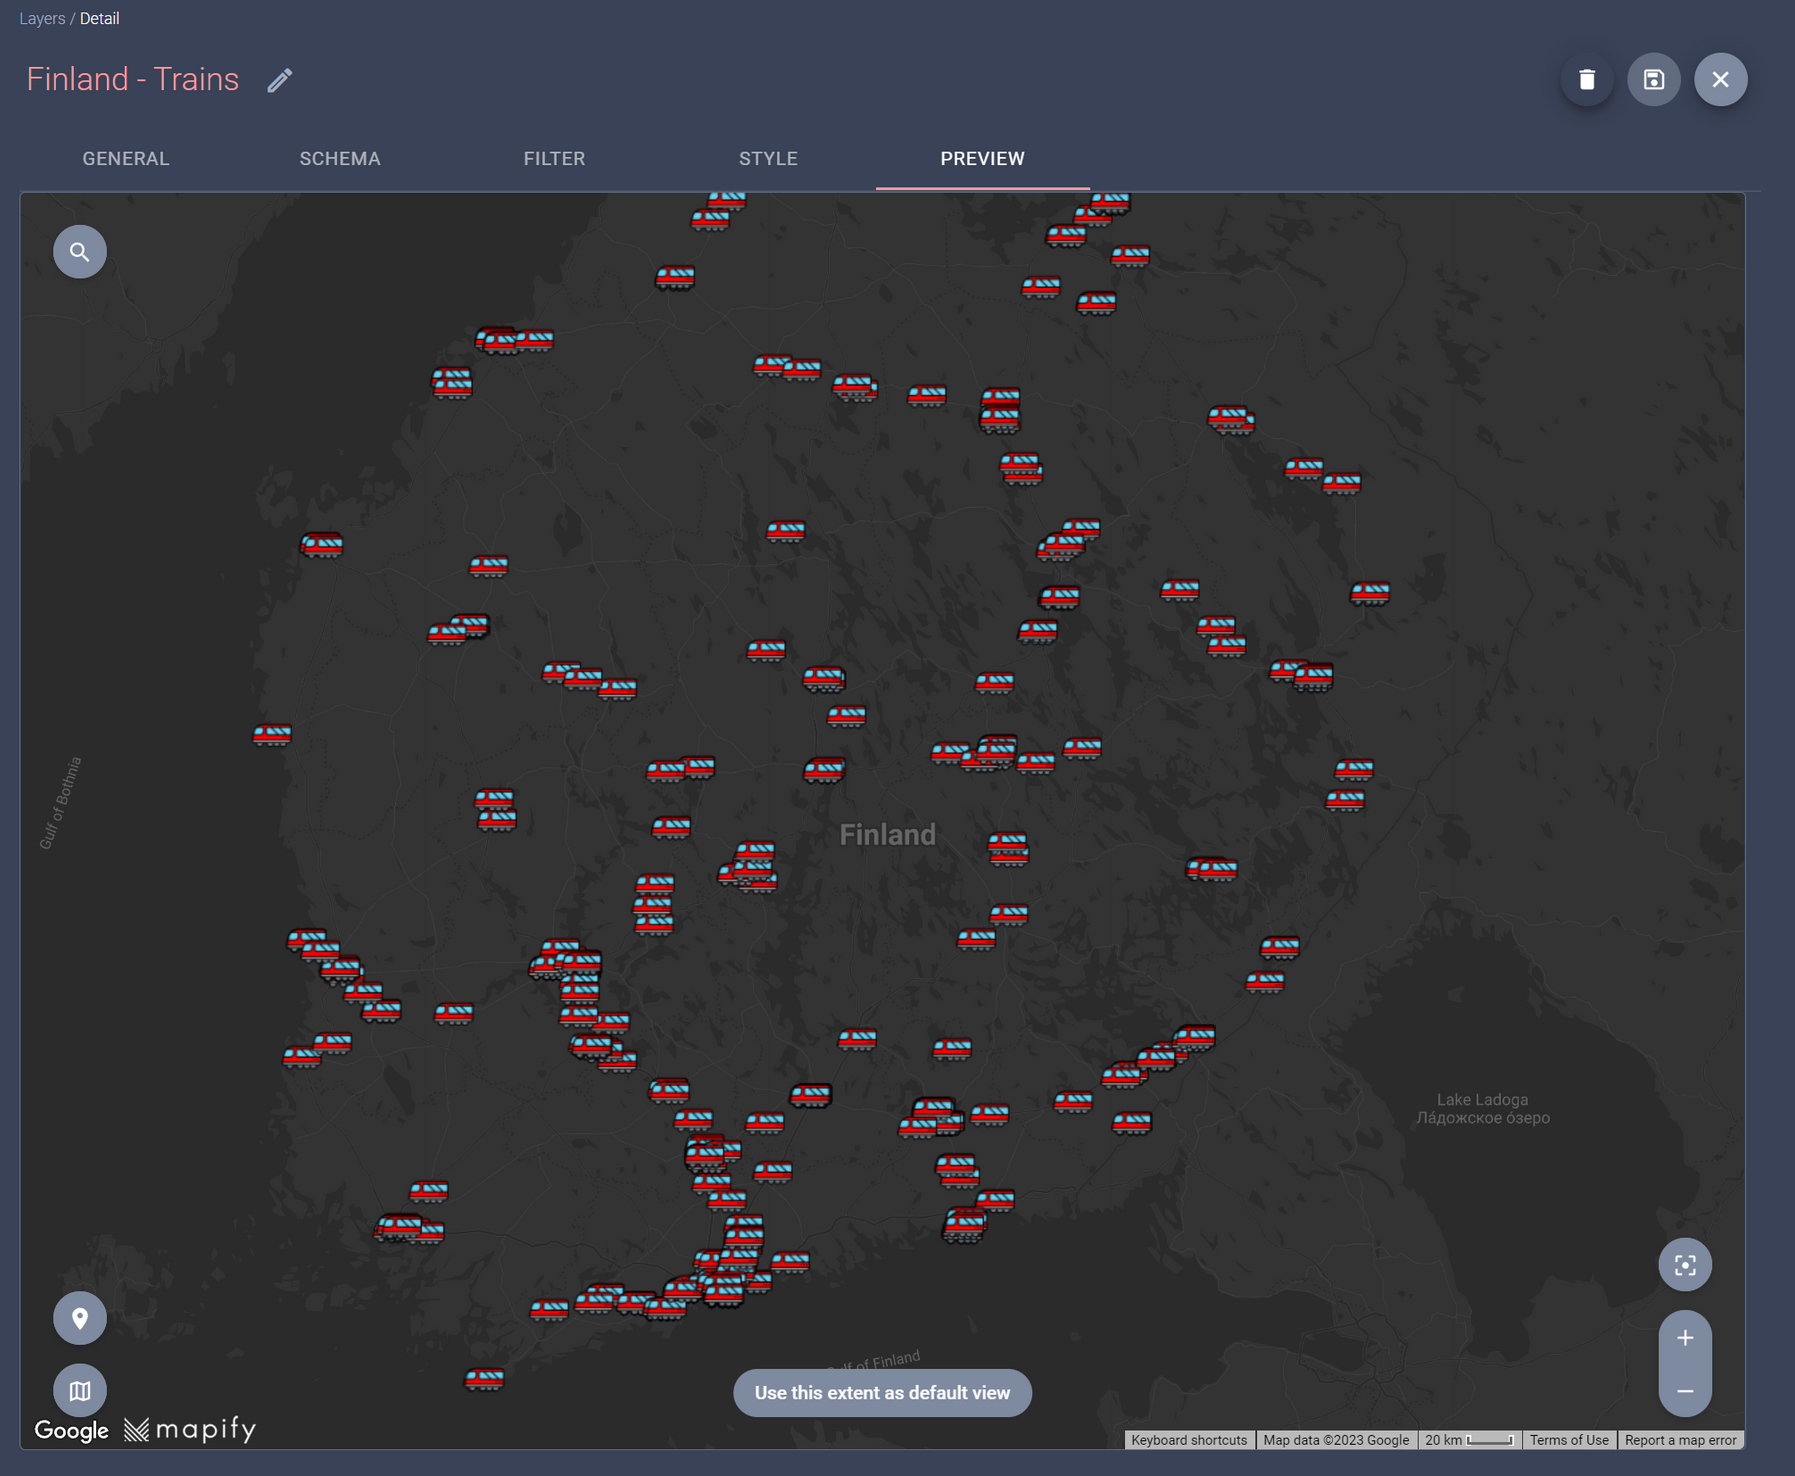
It's time to render our data in a Mapify Layer, so just create a new real-time layer connected to the train location Dataset.
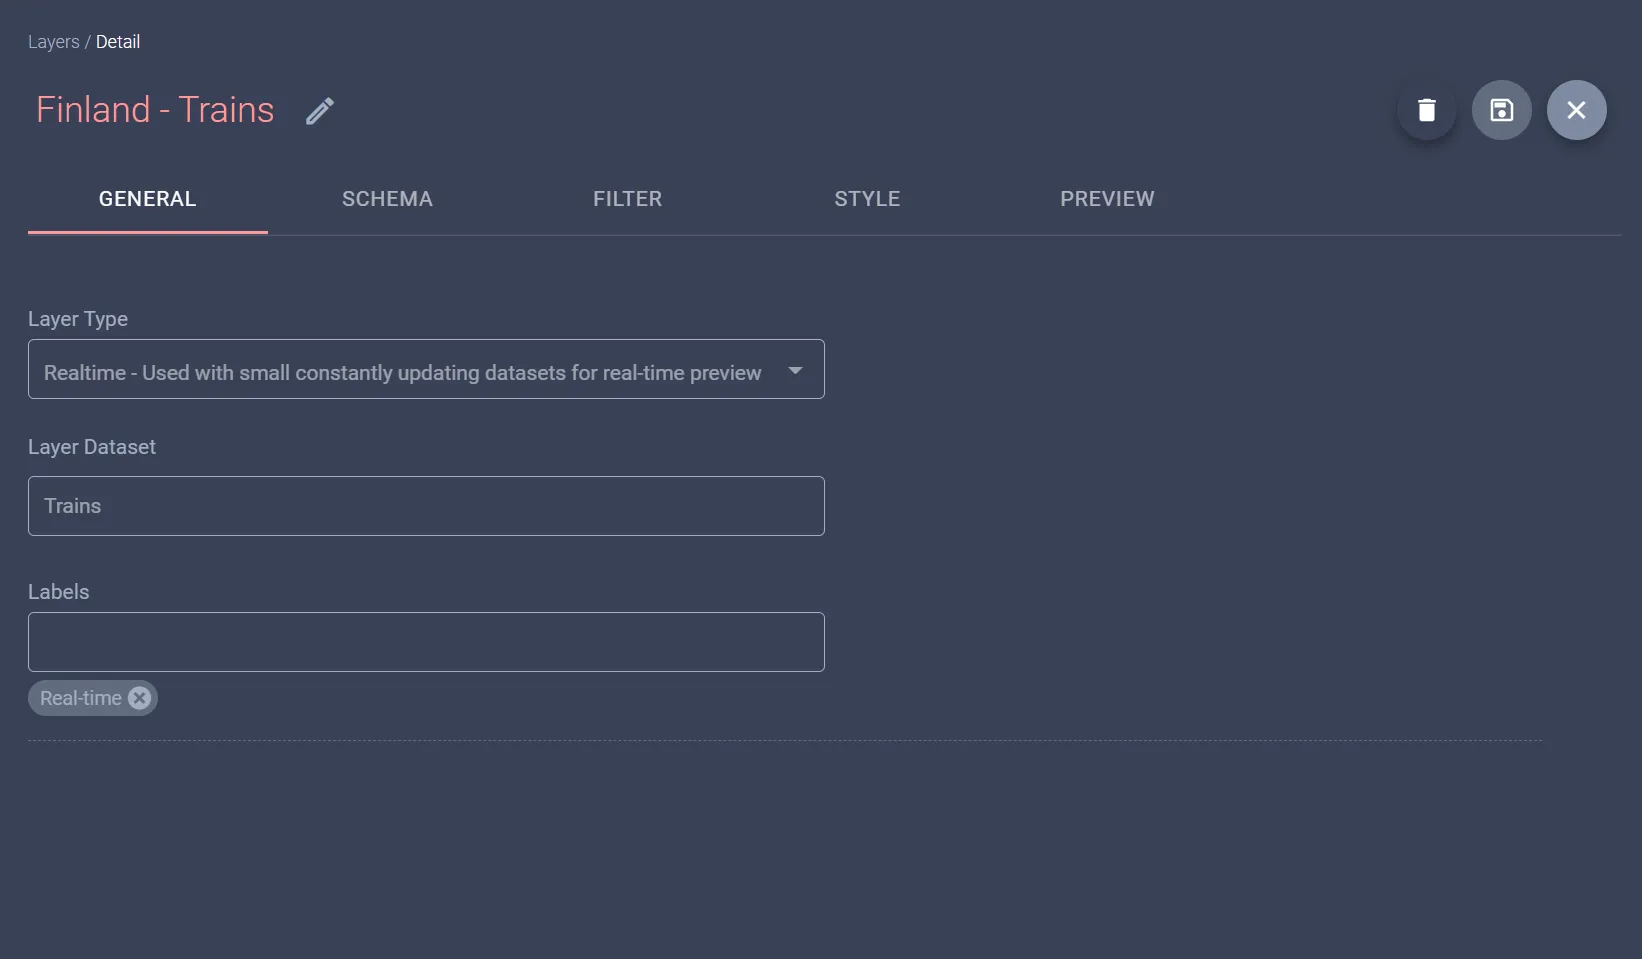
Save your new layer, and you'll be able to preview your amazing data live over Google Maps right away! Every time the data is updated in the Dataset, the layer renders those changes in real-time.
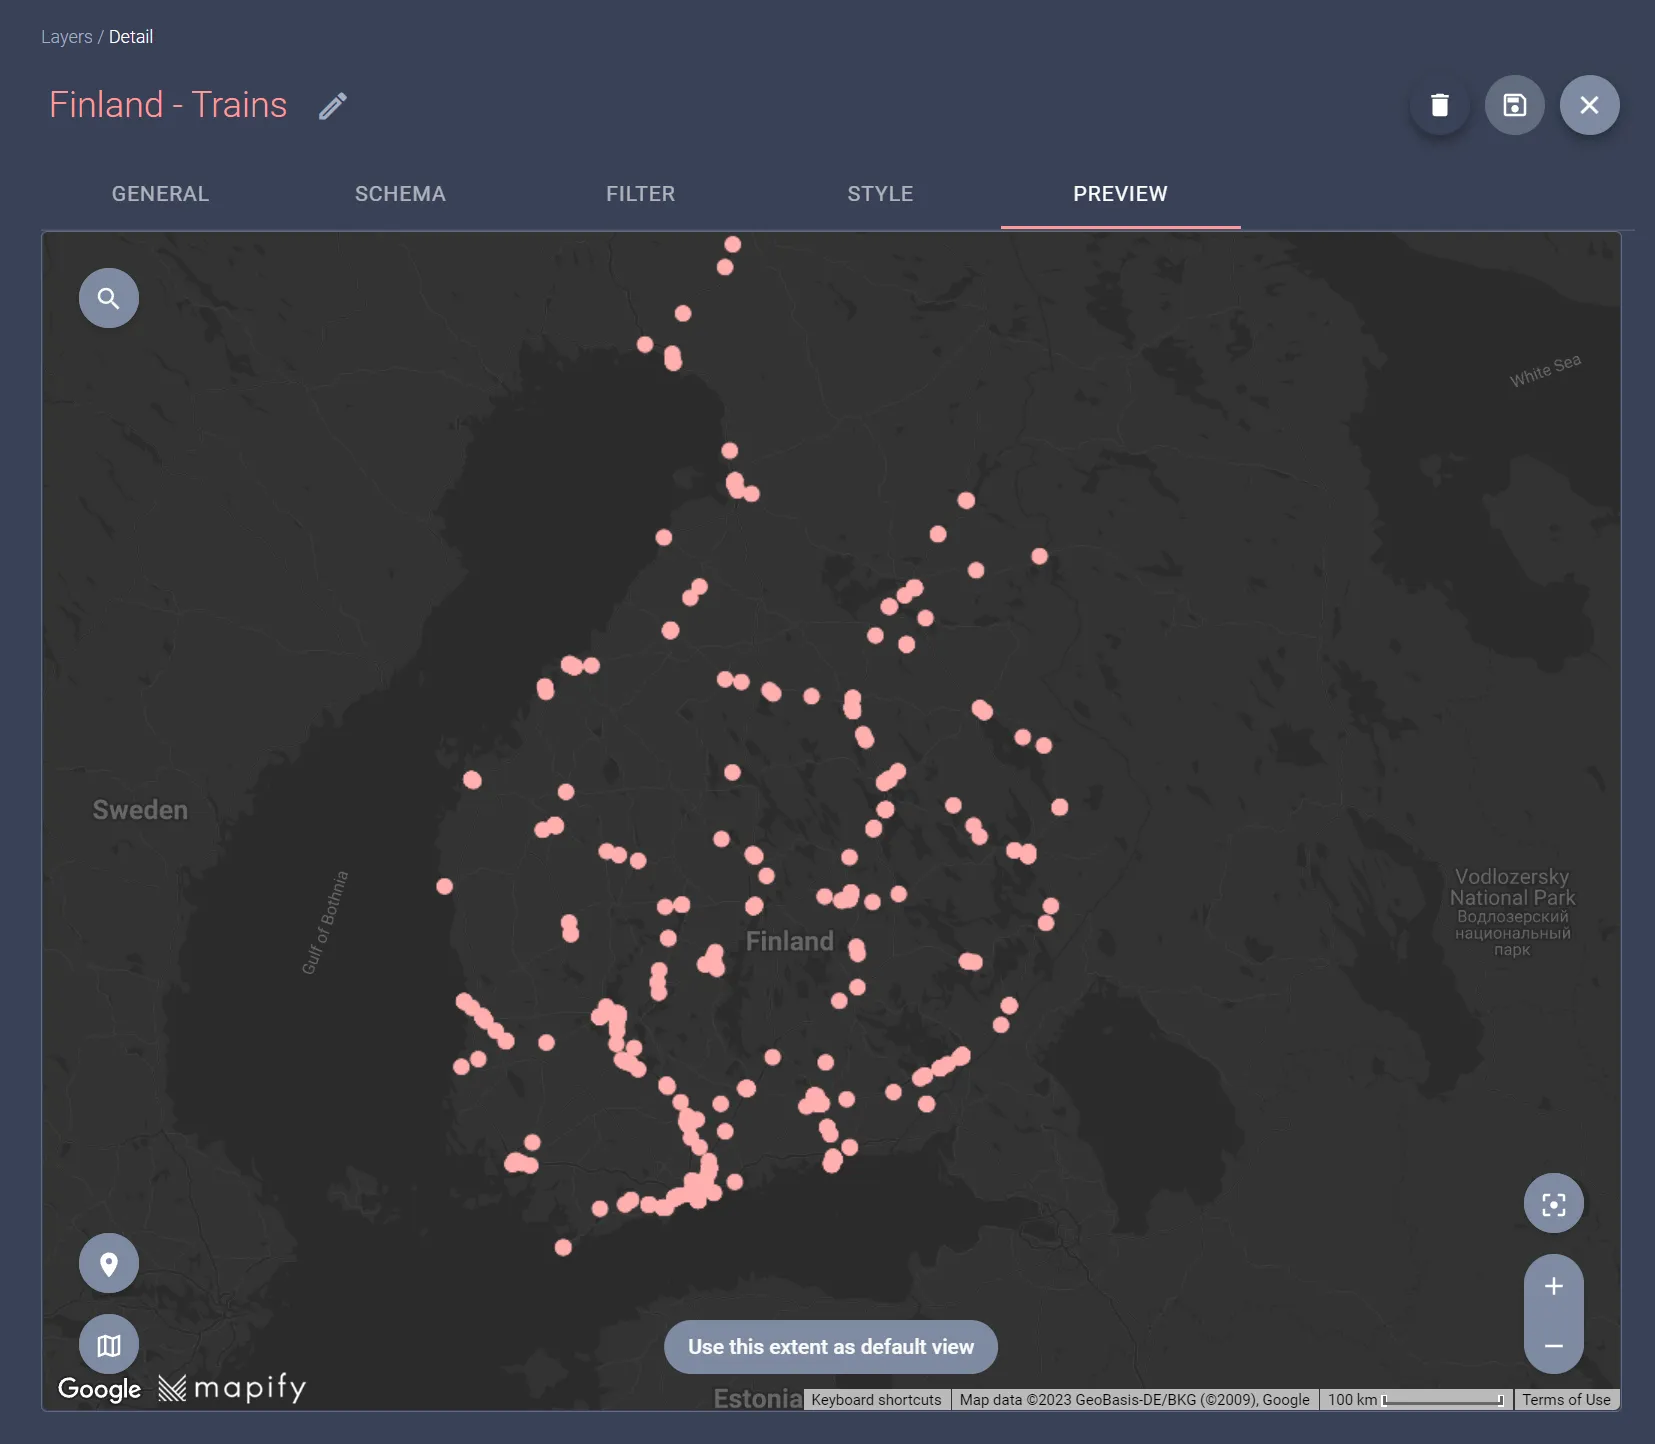
Keep in mind that you can use the Style tab to customize the styling of your rendered data, including using attribute-based rules. Here's a simple example using a small icon to represent the trains.
5. Create a Map with your layers
You could already use the layer you created in Step 4 in your own application through our Mapify SDKs and have the data shown in real-time over a map. But what if Mapify could quickly generate a web application with the map already embedded for you? Follow these last steps and find out for yourself.
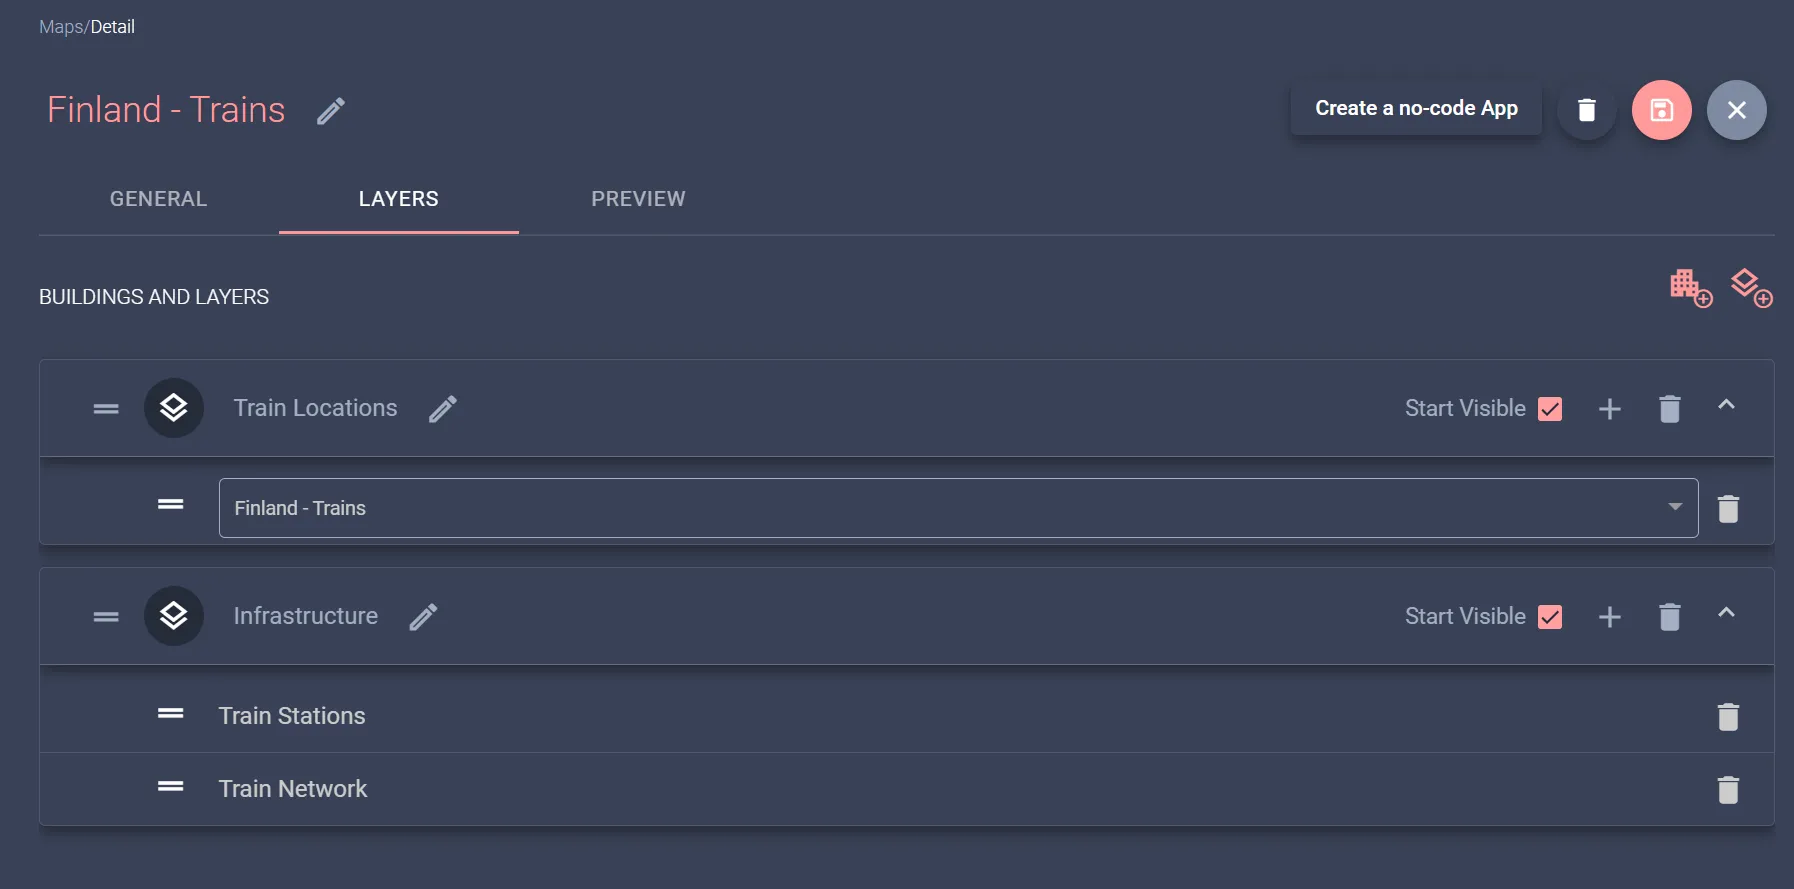
Mapify allows you to compose a visual map comprised of multiple layers.
I know you created only one layer in the previous steps, which is fine, but I cheated and added two more just for context, for the train network and train stations.
There's no need to update those in real-time, so I just uploaded a shapefile for the network and a GeoJSON with the train stations. Creating the Map is as simple as selecting layers and the order in which you want them to be rendered on the map.
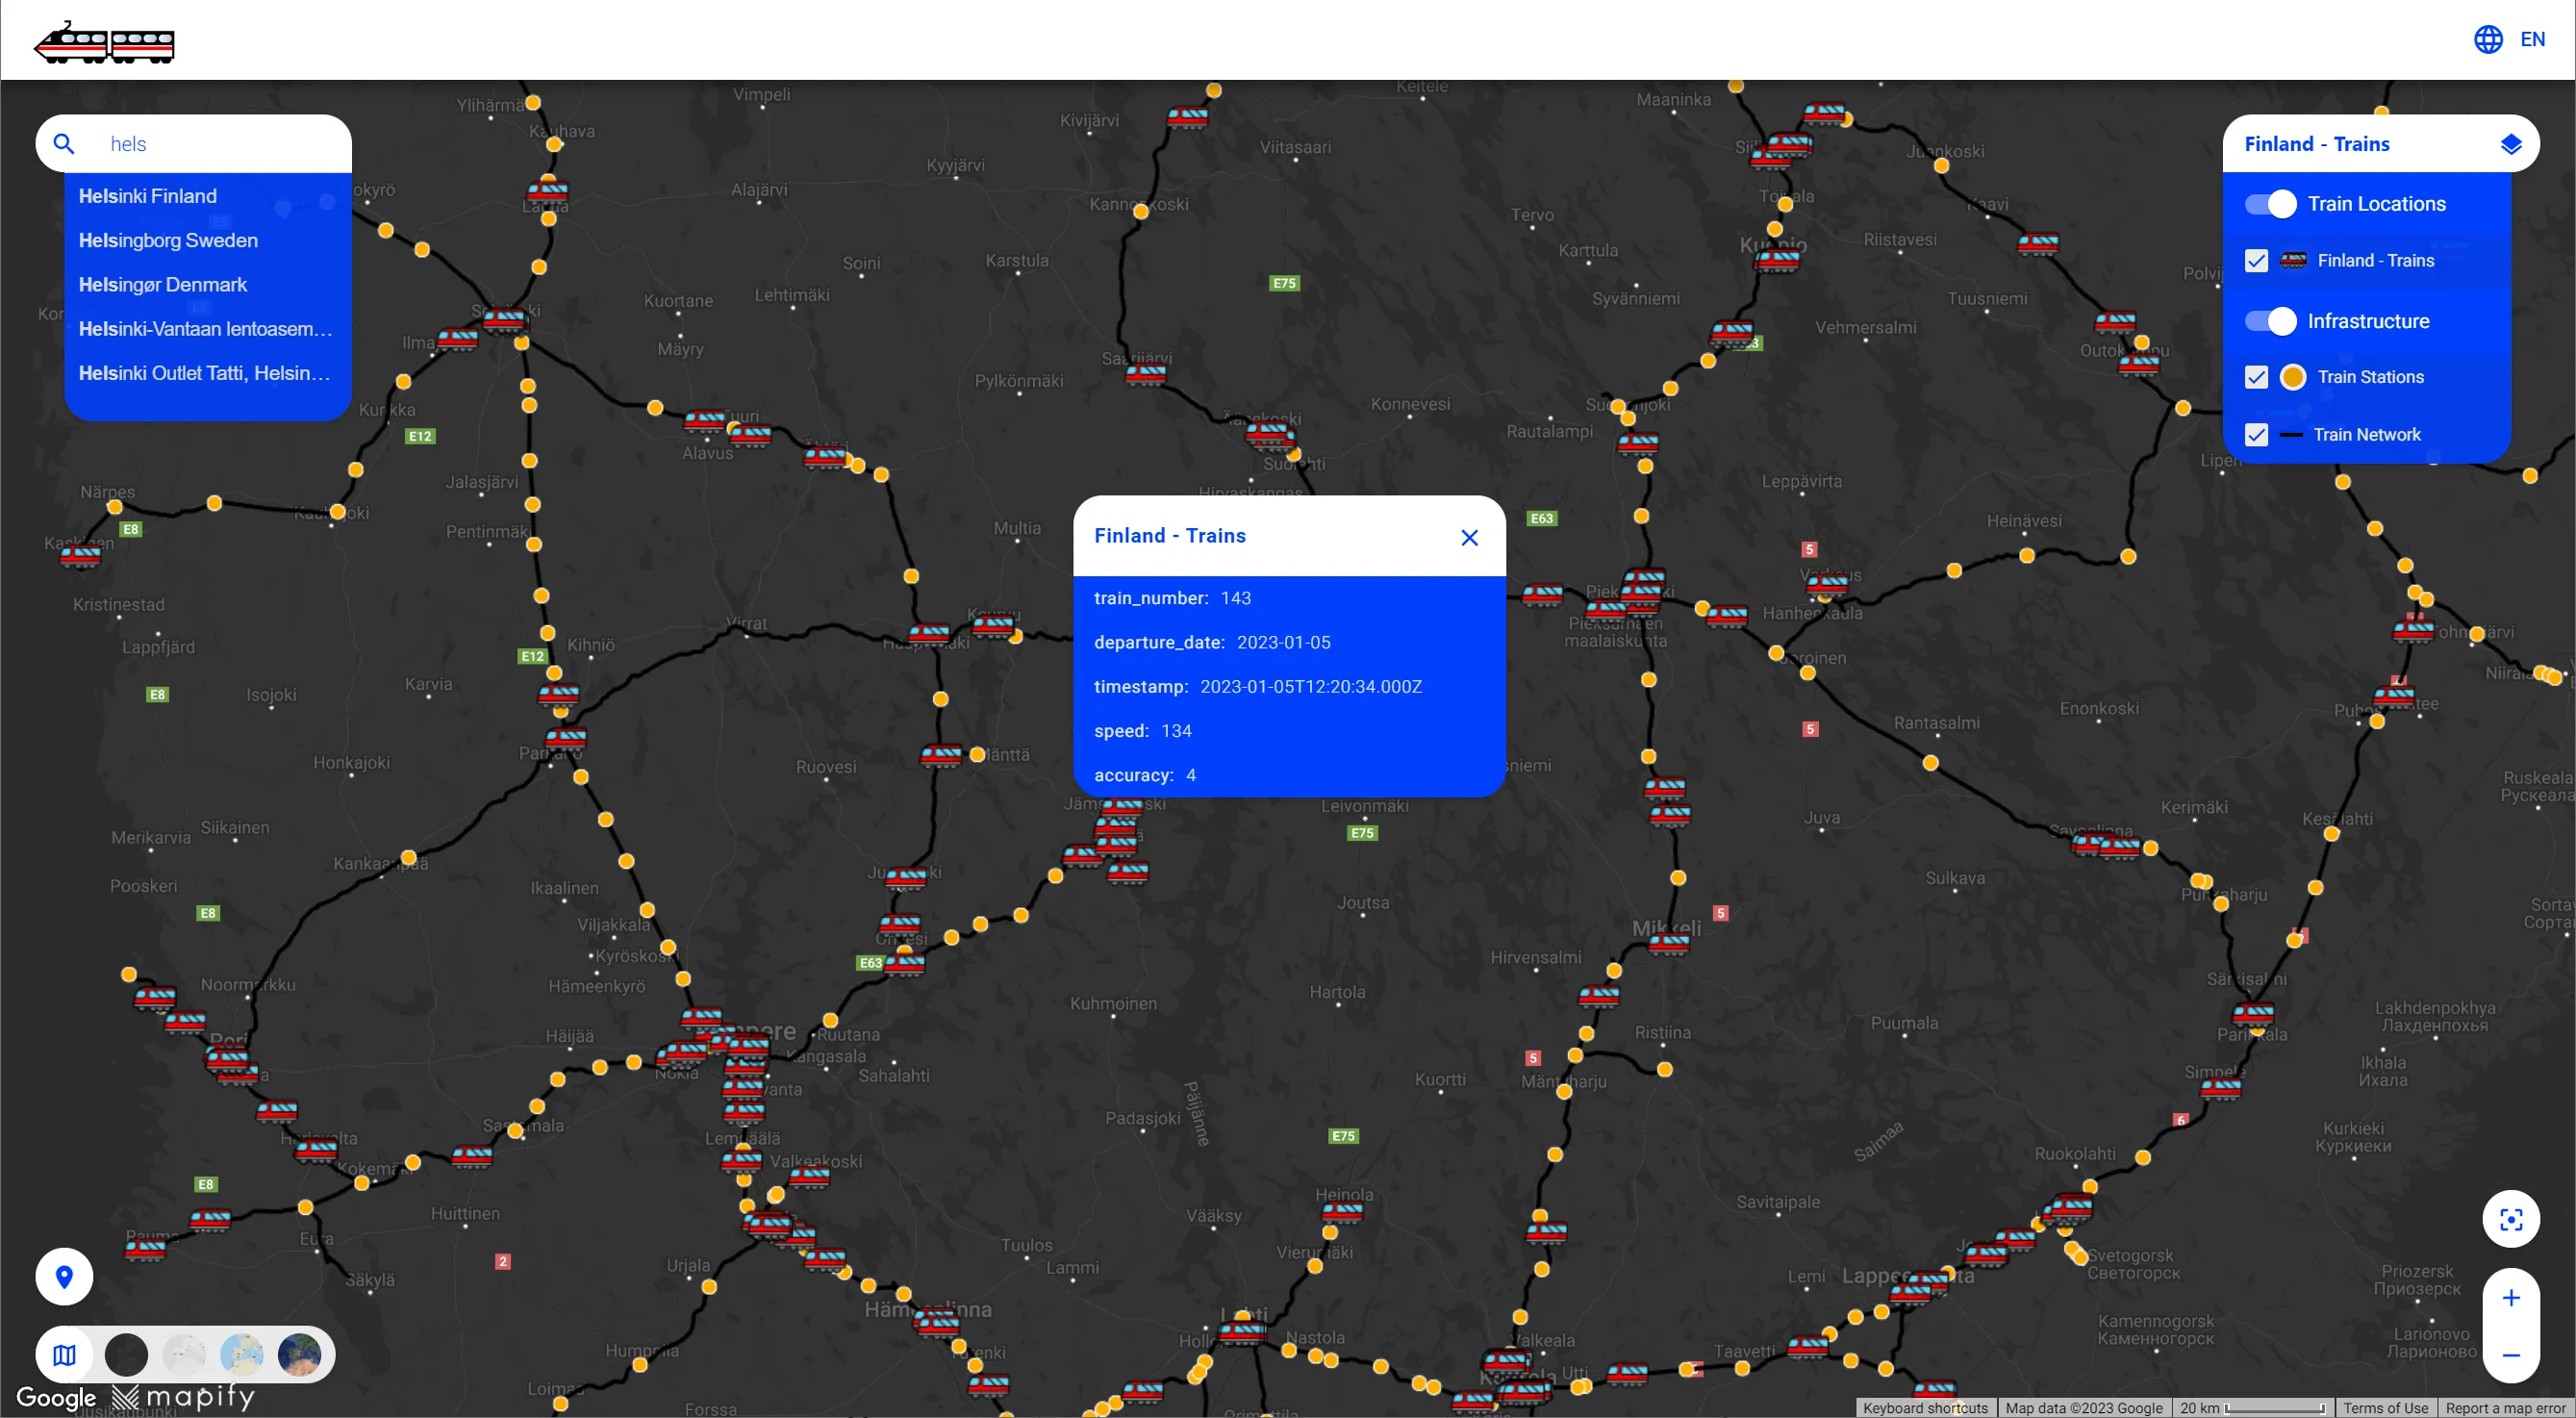
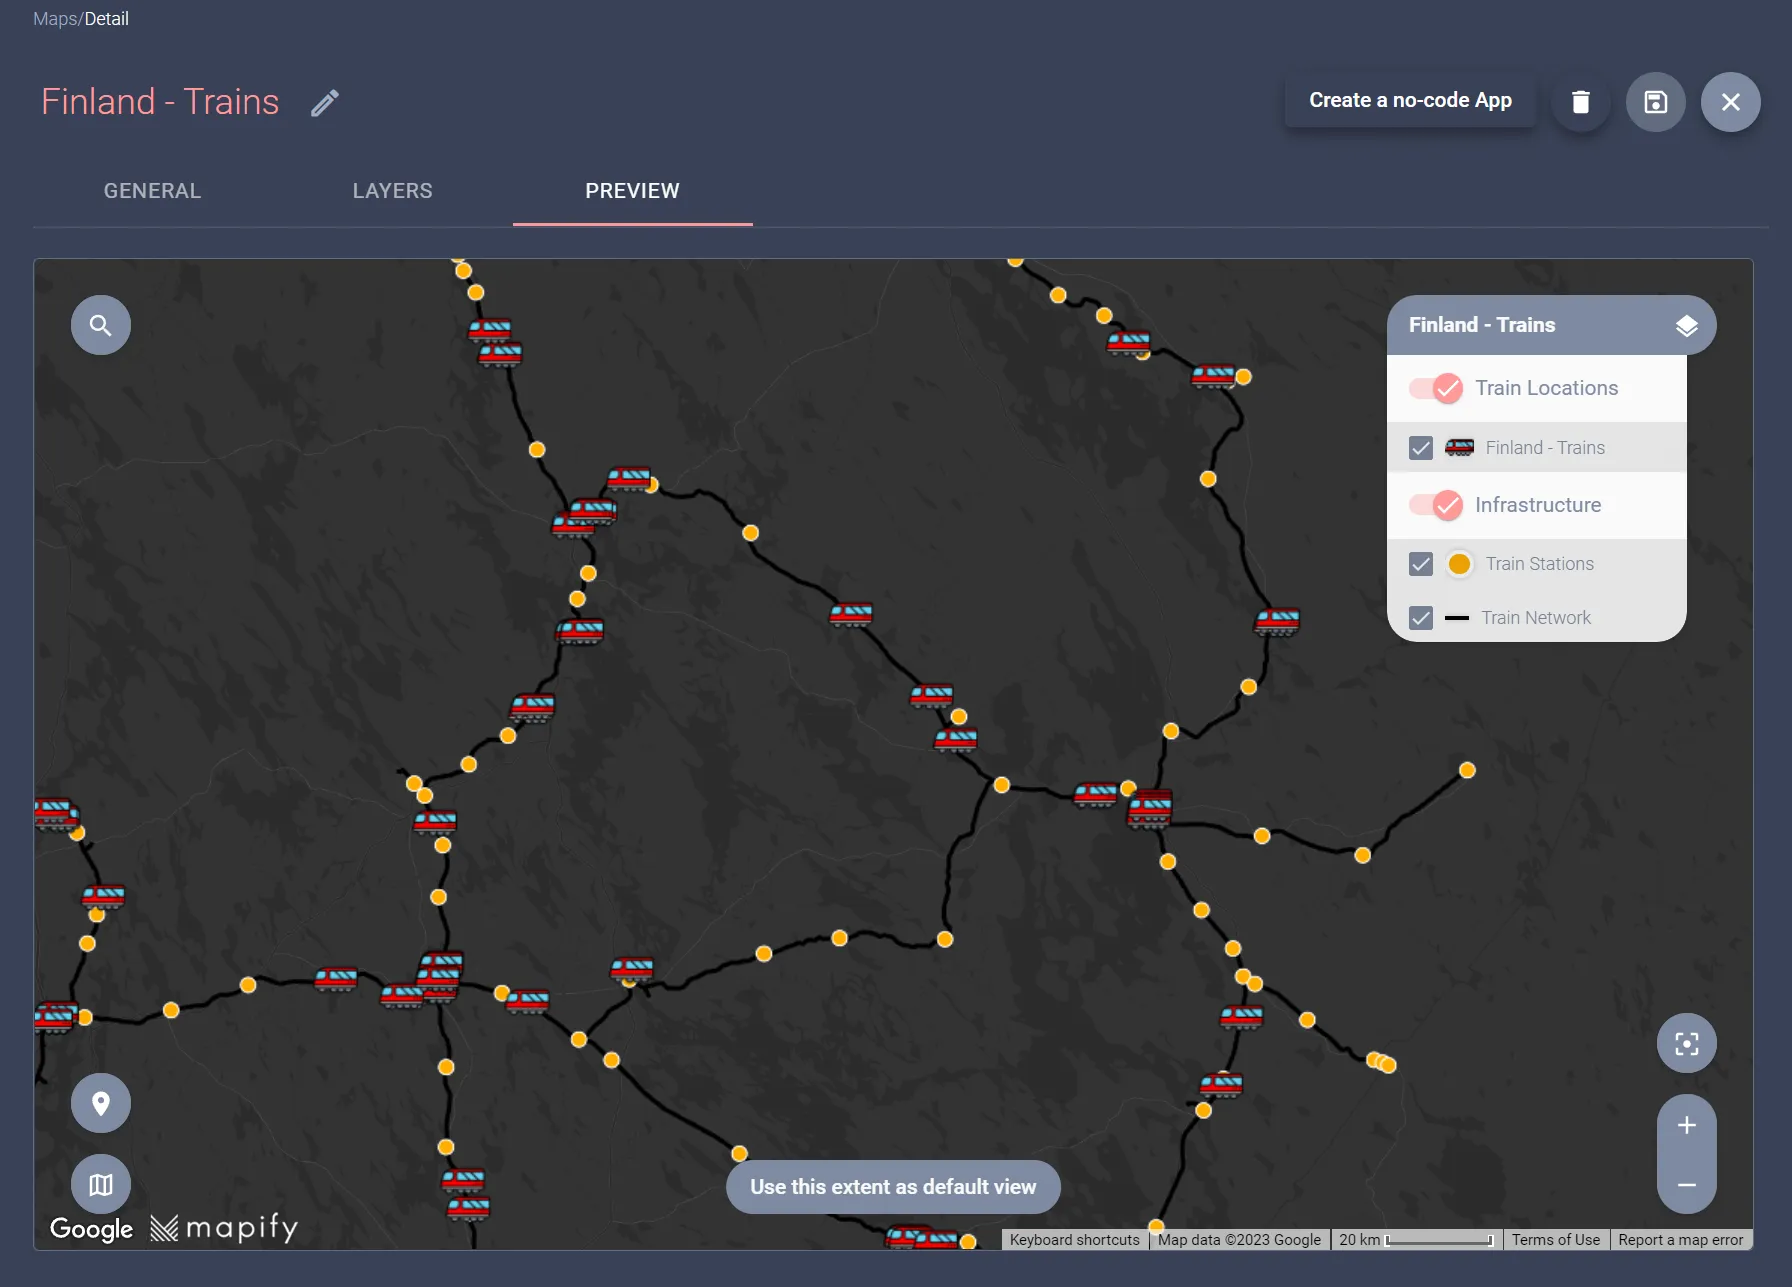
Once you have the layers set up as you want them, simply save the changes and check the preview. Mapify generates the map legend and all the map controls for you!
6. Generate a shareable Mapify Web App for your users
The final step is to have Mapify generate a web application for us, allowing us to customize its styling and select which features and tools will be available to the users.
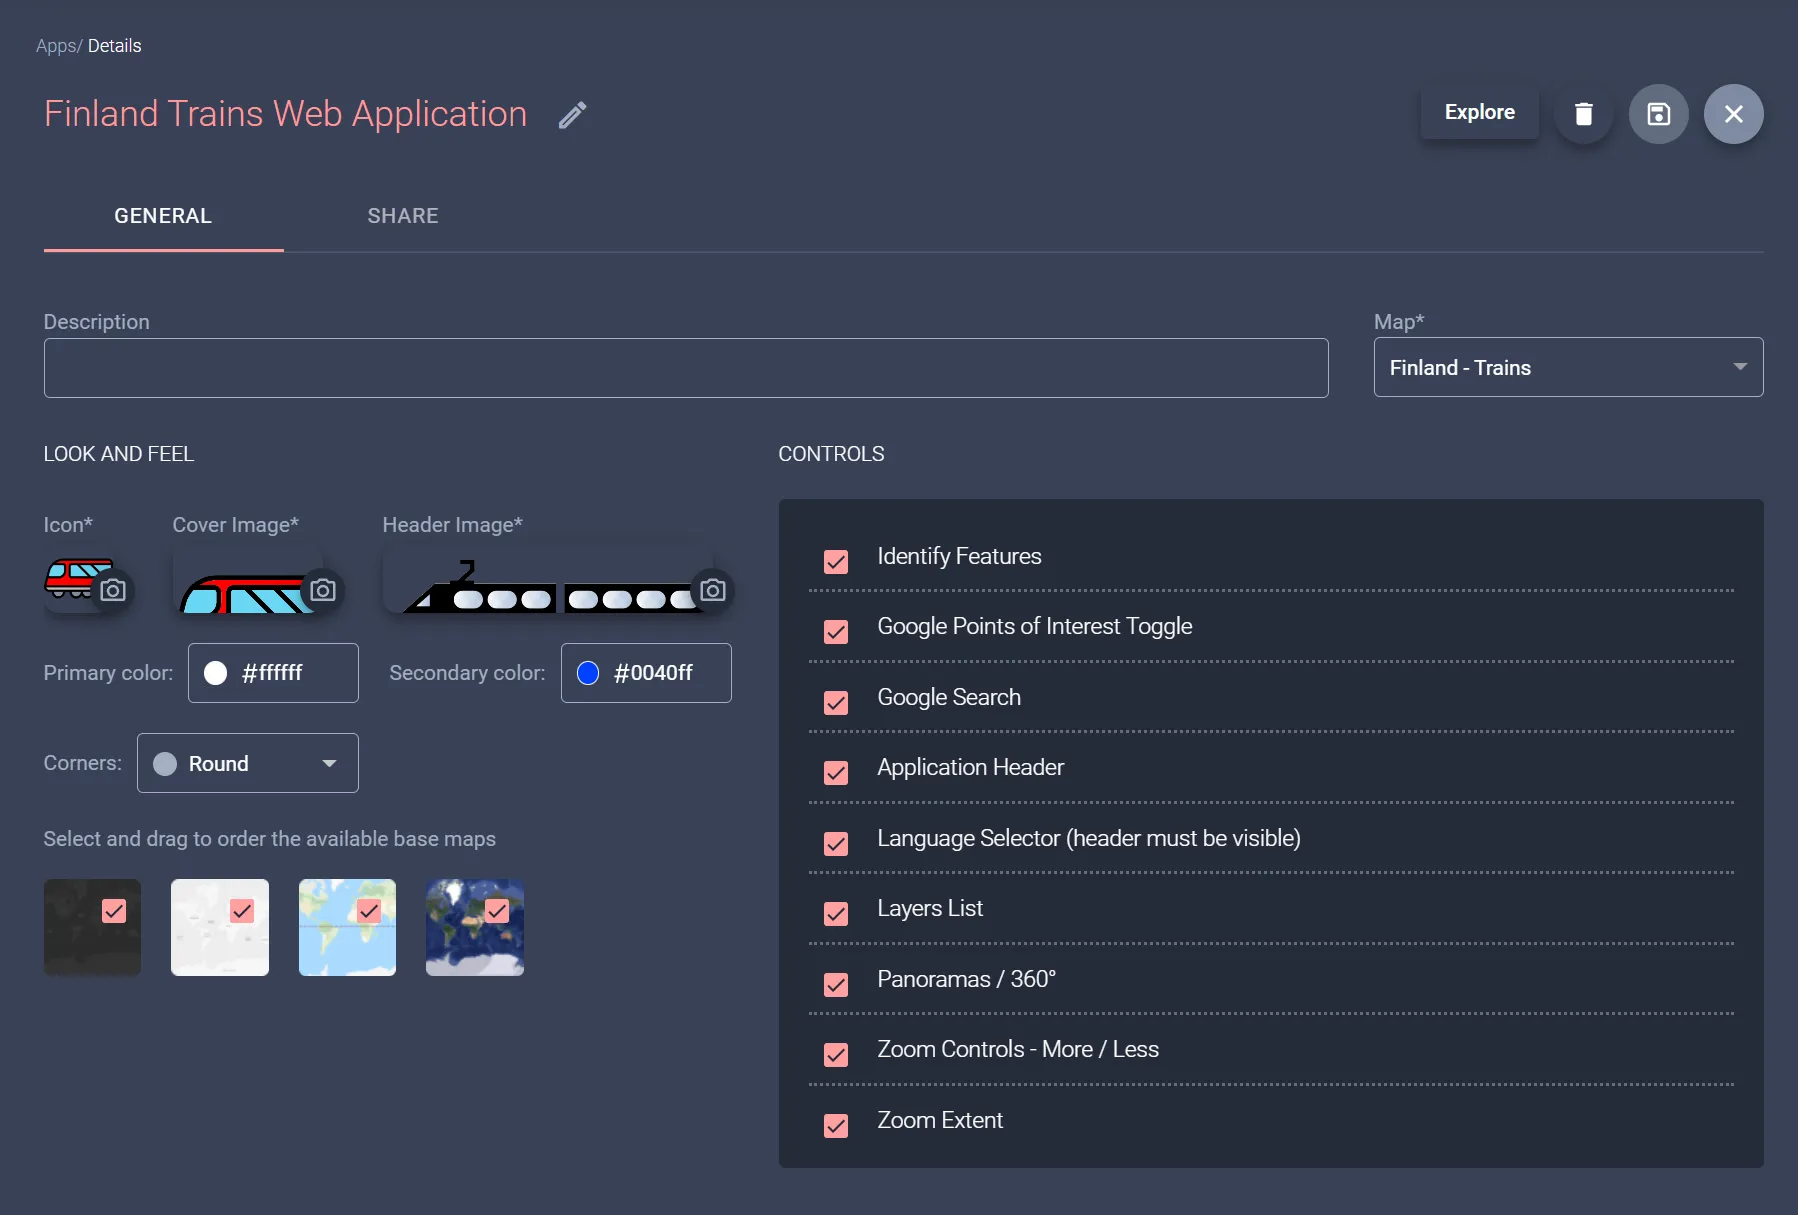
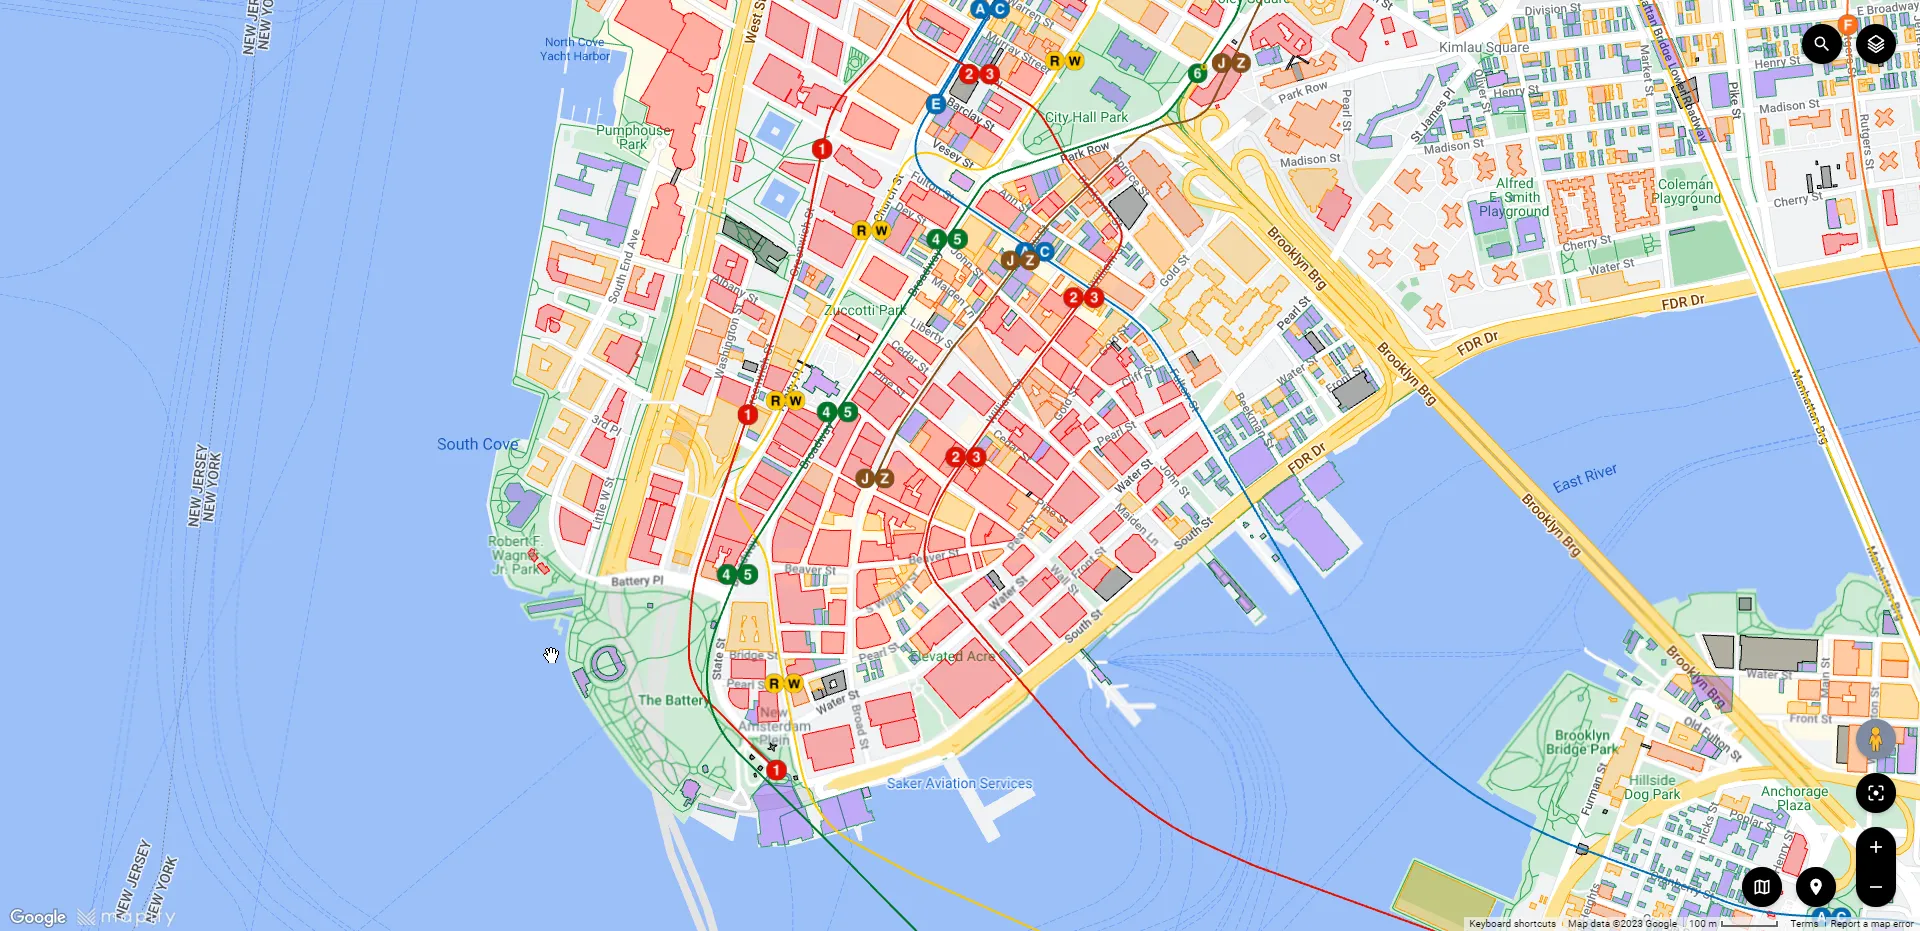
Below you can see the preview of the resulting web application generated and hosted by Mapify for you. No code or infrastructure is needed, just share it with your users!

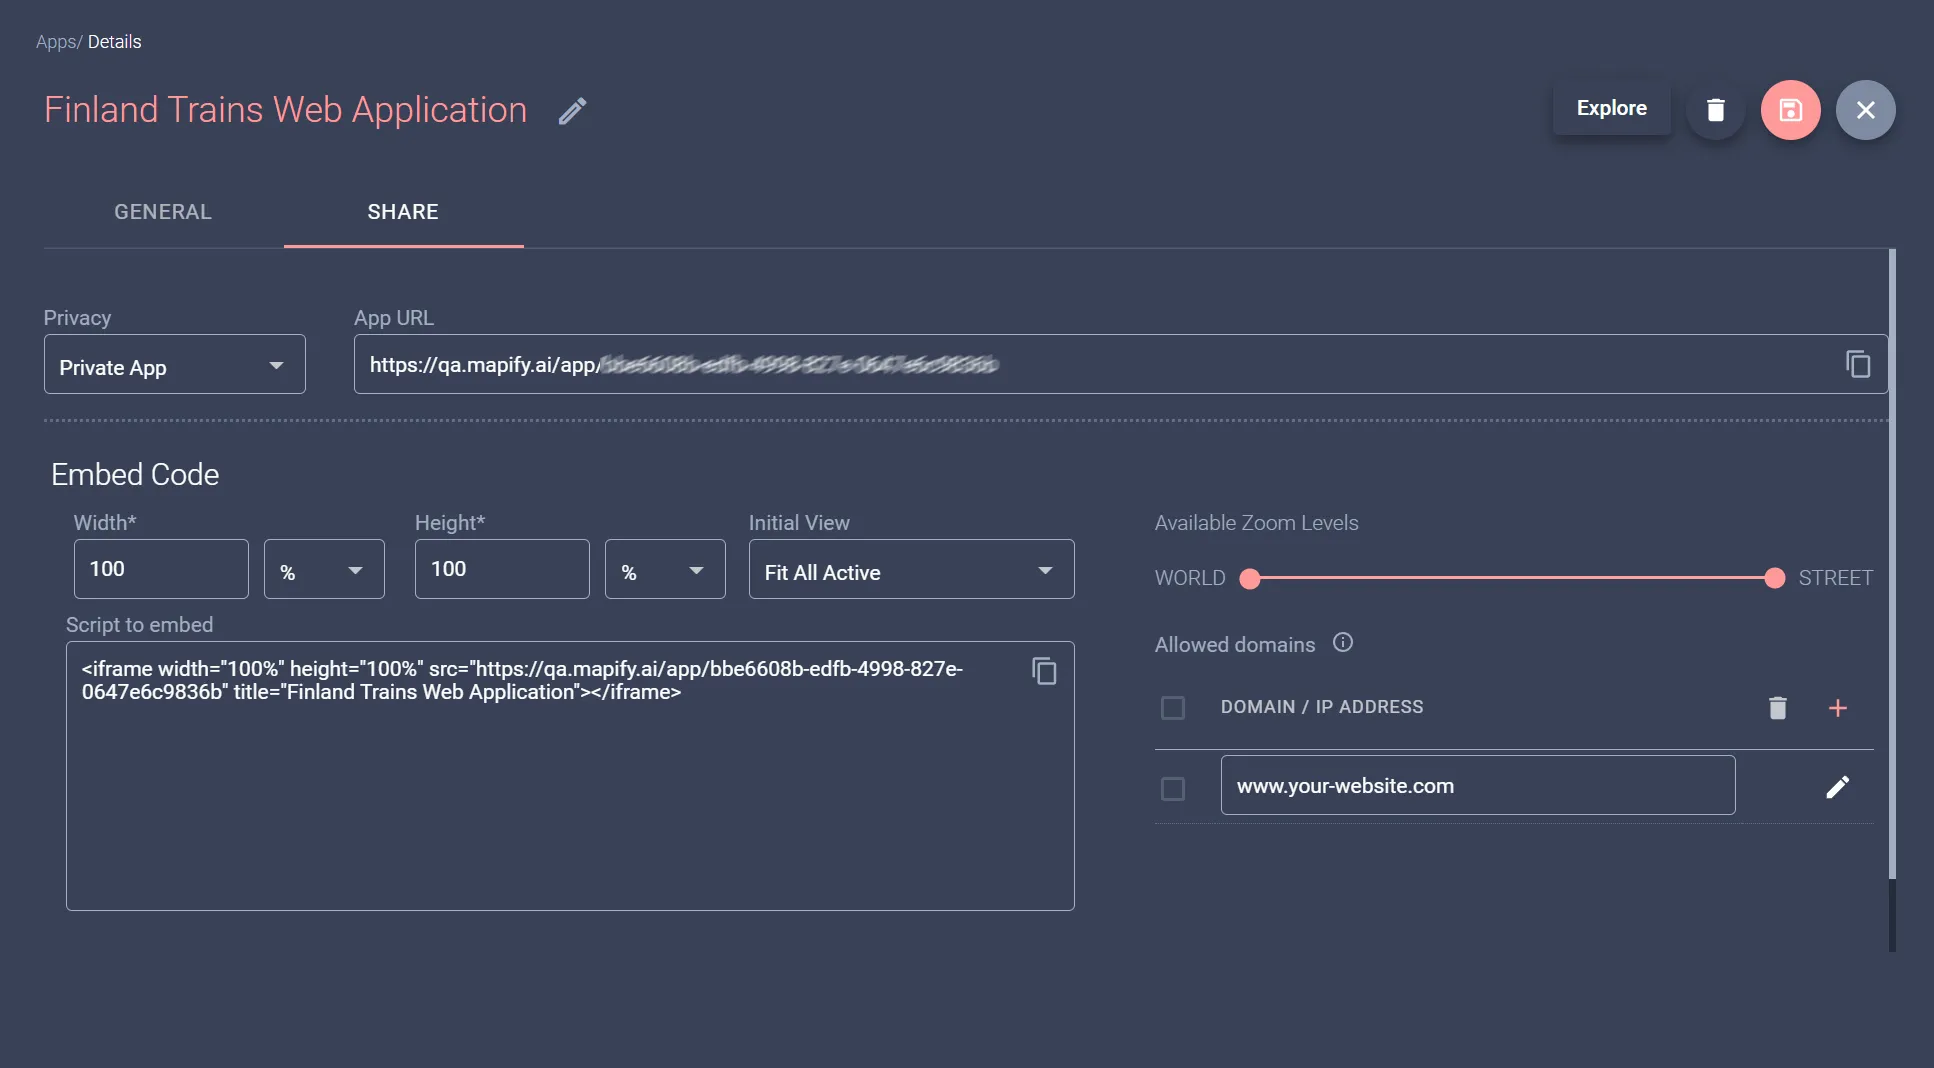
If you prefer to embed the resulting application in your own website, limit the allowed domains to use it, and configure other sharing settings, that is also possible, using the provided application Sharing panel as illustrated below.
That's it, really!
More of a video person? Here's a different example for you 👇
There's so much more you can do with Mapify, but we hope this article provided a great starting point.
Mapify can be great in helping you easily and quickly implement proof of concepts for customers or demonstrate an MVP to your potential investors, and follow your progress right through to a global-scale solution.
We didn't lie about the 6 easy steps, right? Try doing it yourself by requesting a Mapify trial.
Or book a meeting to explore more about Mapify!