No code geofencing solution in five minutes with Mapify
October 26, 2021
Mário Sobral
In this post you will go through the process of creating a simple geofencing process to include in your own solution, without requiring you to write any code. You'll build a quick and simple solution to have email alerts sent to you whenever a vehicle moves into one of several restricted zones.
Building a simple geofencing solution with Mapify
Requirements:
- Mapify account (you can request a trial account here)
If you want to dive right in the deep end without following this tutorial, feel free to request a Mapify trial here, or click here to schedule a talk with us, and start creating your location intelligence solutions today!
Why would you need geofencing in your business?
Simply put, "a geofence is a virtual perimeter for a real-world geographic area". Many businesses use geofences to provide value added services to their users. You can see geofencing in action in asset tracking applications which send alerts when an asset is inside or outside a specific restricted area but there are many other possible applications.
Geofencing step-by-step guide
In this article you will be using Mapify to create a simple geofencing solution for sending your email alerts when a fictional vehicle enters one of three restricted zones that you'll also define. And you will be able to have it up and running in 3 quick and easy steps:
- Step 1 - Create a "Restricted Zones" Dataset and Layer where you will define the restricted zones as polygons.
- Step 2 - Create an "inbound-vehicle-positions" Data Feed to handle the incoming vehicle locations messages.
- Step 3 - Create a "Process Vehicle Positions" Workflow which will process the vehicle messages and determine if each vehicle position received is inside one of the restricted zones and, if so, sends an email alert.
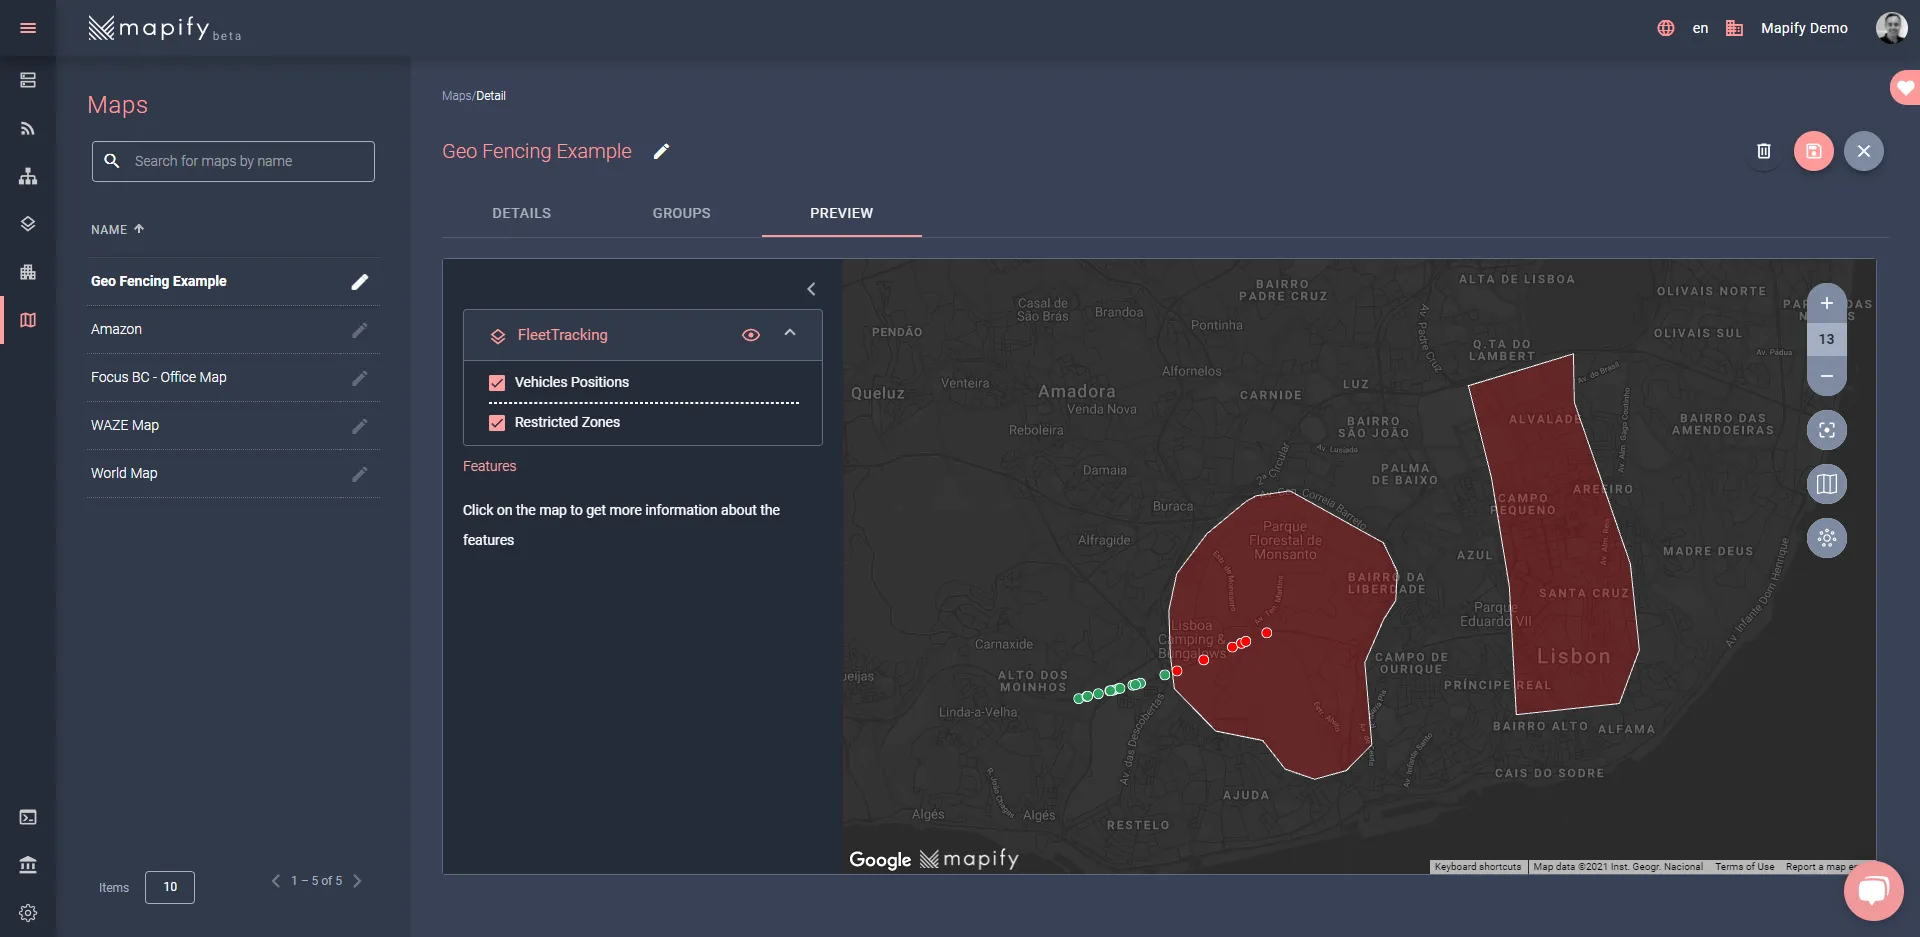
- Optional - Create a Map to display the restricted zones and the transgressions in real time.
1. Create a "Restricted Zones" Dataset and Layer
The first step is to create a Dataset to hold the restricted zones polygons.
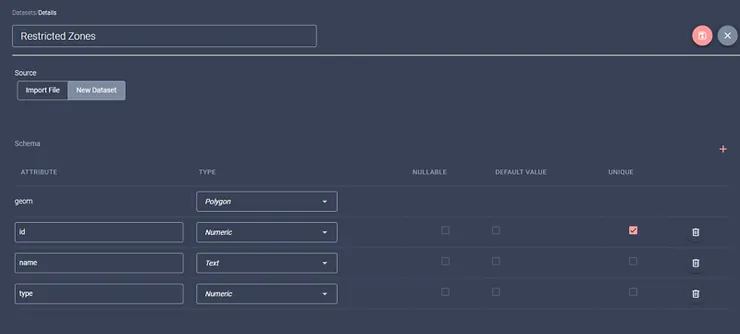
Create a new Dataset, name it "Restricted Zones", select "Polygon" as its geom type, and add the following fields:
- id (numeric)
- name (text)
- type (numeric)
Once the "Restricted Zones" Dataset is created, you can add polygons to it, which will define the restricted zones. In the Dataset's details screen, click on the "Edit data on Editor" button to access Mapify Editor.
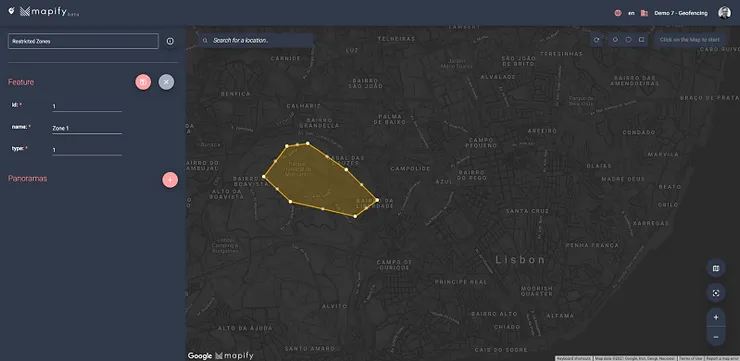
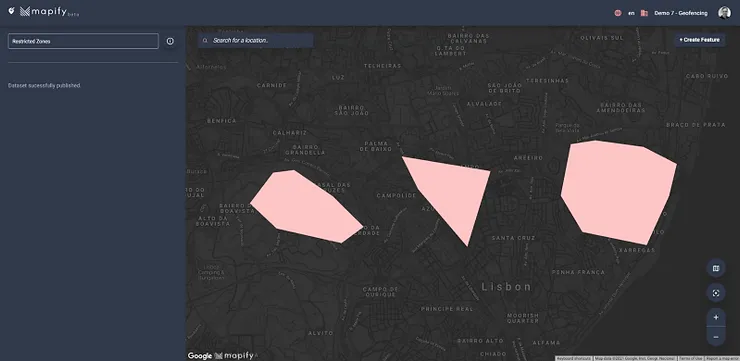
In Mapify Editor zoom in to Lisbon (Portugal) until you have a pretty good view of the city area, and click on the "Create Feature" button to add a new restricted zone. Select "Polygon" from the polygon creation toolbar, and draw a polygon which represent one of your restricted zones.
For its attribute values, use:
id = 1name = Zone 1type = 1
Save your new polygon. You can see an example of what it could look like in the screenshot below:
Add two more restricted zones, using the following values for its attributes:
id = 2
name = Zone 2
type = 2
and
id = 3
name = Zone 3
type = 1
After you're done adding your restricted zones, be sure to publish your changes to the Dataset, by clicking the "Publish Dataset" button in the Mapify Editor.
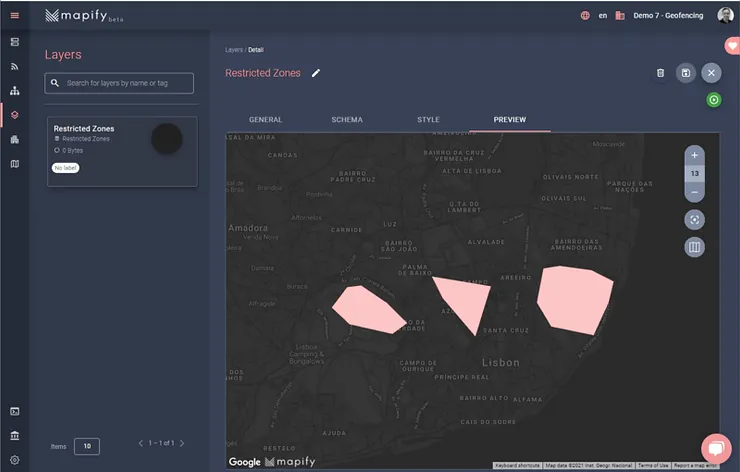
Depending on how you drew your restricted zones polygons, you will end up with something similar to the screenshot below:
Now all you need to do is create a new "Restricted Zones" GeoJSON Layer based on the "Restricted Zones" Dataset:

Don't forget to publish your layer once you create it, and you should end up with a layer that renders your restricted zones:
2. Create an "inbound-vehicle-positions" Data Feed
For the purpose of this article, your Data Feed will be able to handle incoming messages such as the fictional example below:
{
"vehicle_id": "Vehicle01",
"vehicle_type": "Car",
"location": {
"type": "MultiPoint",
"coordinates": [
[-9.183098,38.766037]
]
}
}
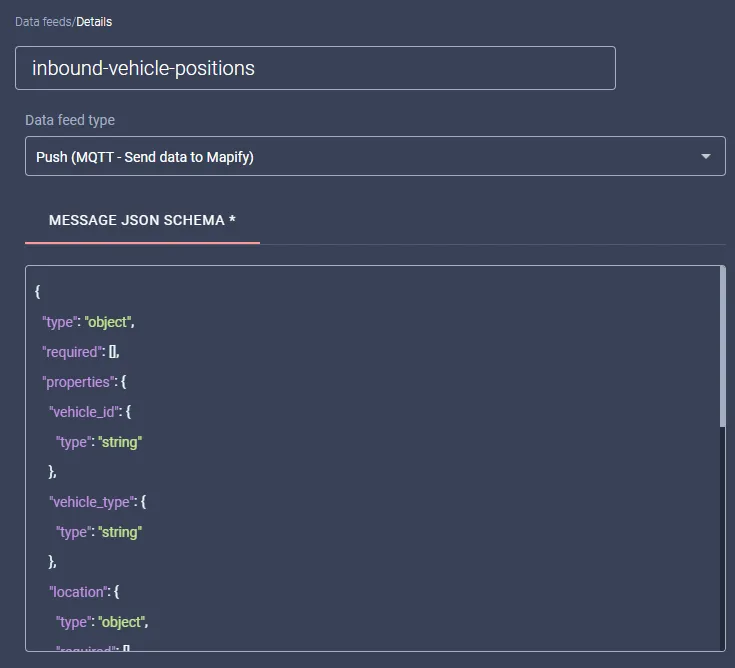
Create a new Data Feed name it "inbound-vehicle-positions", select "Push" as its type, and copy the following schema to its message JSON schema input box:
{
"type": "object",
"required": [],
"properties": {
"vehicle_id": {
"type": "string"
},
"vehicle_type": {
"type": "string"
},
"location": {
"type": "object",
"required": [],
"properties": {
"type": {
"type": "string"
},
"coordinates": {
"type": "array"
}
}
}
}
}
You should end up with a Data Feed configured as shown in the screenshot below:
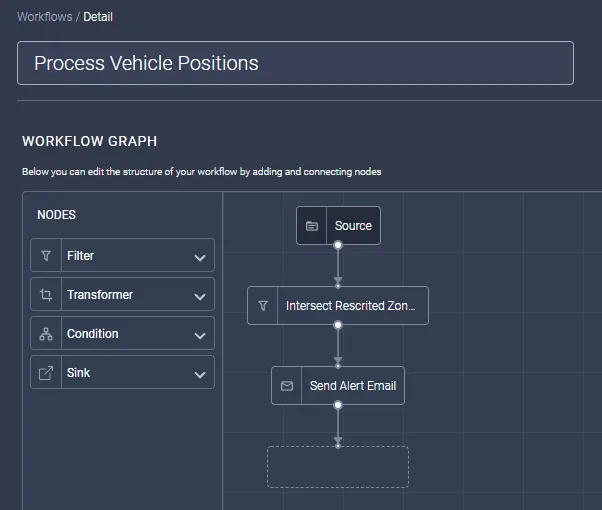
3. Create a "Process Vehicle Positions" Workflow
Create a new Workflow and name it "Process Vehicle Positions". Add three different nodes to it, linking each node to the previous one created:
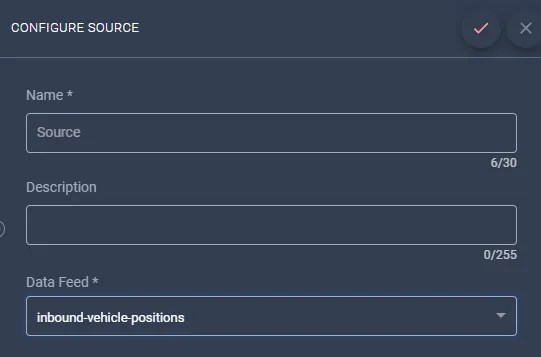
Source Node
The Source node defines which Data Feed this Workflow will subscribe to and handle its incoming messages.
Select the previously created "inbound-vehicle-positions" Data Feed as the source for this workflow.
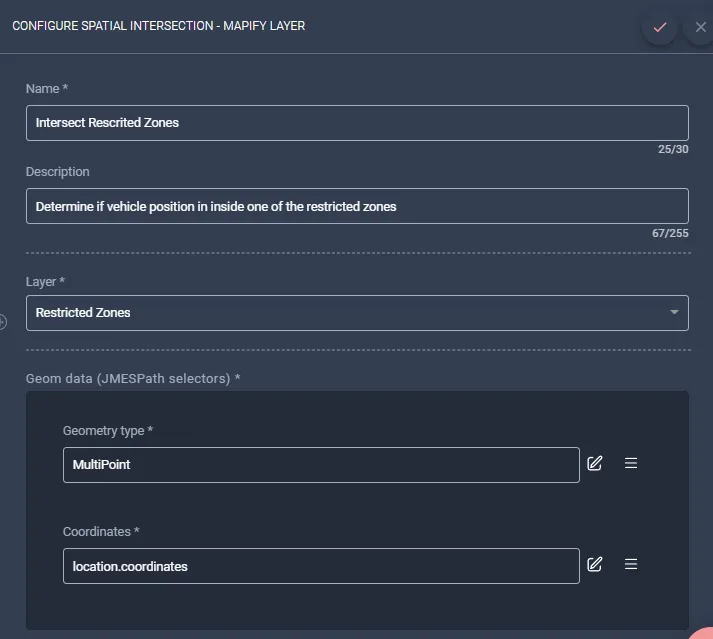
Filter Node - Spatial Intersection - Mapify Layer
The Filter node filters out incoming messages, by only letting through to the next node messages which match its condition (in this case, those whose location data intersects any feature of the selected Layer).
Name: "Intersect Restricted Zones"
Layer: "Restricted Zones"
GeometryType: "MultiPoint"
Coordinates: "location.coordinates"
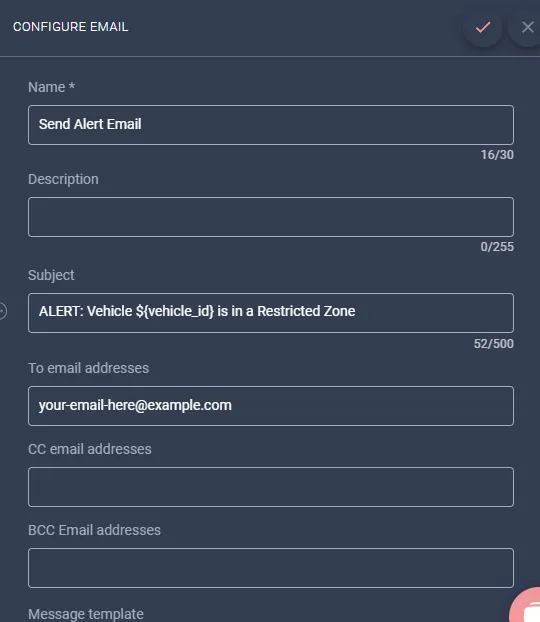
Sink Node - Email
The Sink node is an output node, which in this case will trigger an email being sent for each message it receives from the parent node.
Name: "Send Alert Email"
Subject: "ALERT: Vehicle ${vehicle_id} is in a Restricted Zone"
To email address: (your email address)
Body: "ALERT: Vehicle ${vehicle_id} is in a Restricted Zone"
After you have setup your workflow nodes, you should end up with a workflow looking like the screenshot below:
Run it !
In order to test and demonstrate your geofencing process working, we'll use Mapify Simulator to generate simulated vehicle positions and send them to the previously created Data Feed.
In our example above, inbound vehicle messages include vehicle_id, vehicle_type and location attributes. So we'll configure the simulator to generate some vehicle's data and send it to the "inbound-vehicle-positions" Data Feed.
In order for Mapify Simulator to access the Data Feed and publish messages to it, you will need to create an API Key with the following claims:
Data Feeds - read
Topic Messaging - write

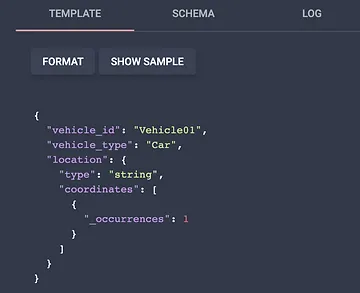
Open Mapify Simulator in a new tab in your browser and copy the API Key you just created to the respective field. You will be able to select the "inbound-vehicle-positions" Data Feed, and it should automatically display its message schema in the Template input box.
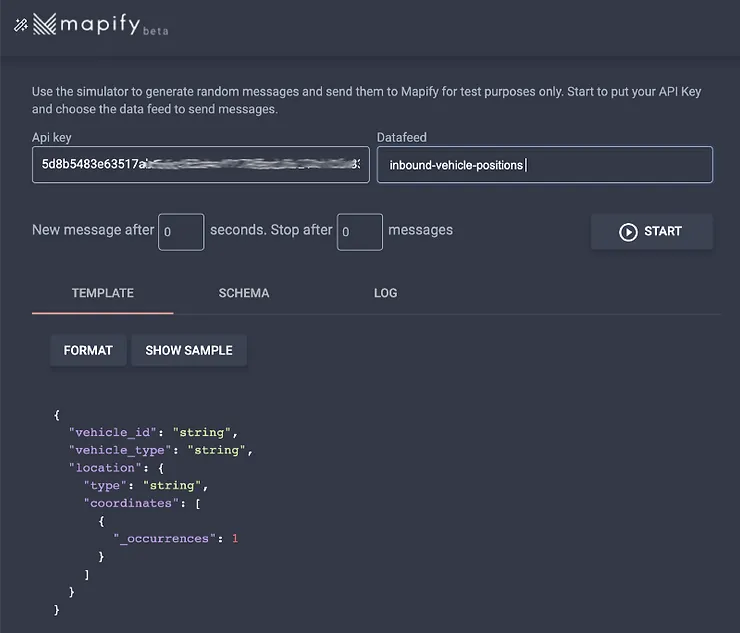
In this article you will only simulate a single vehicle moving at this time so, in the message template, replace the "string" value in the vehicle_id field with "Vehicle01", and for the vehicle_type field value replace it with "Car".
You will want to simulate your vehicle moving around, preferably on a path that will have it cross one or more of the restricted areas so that you can test the geofencing alerts you configured previously.
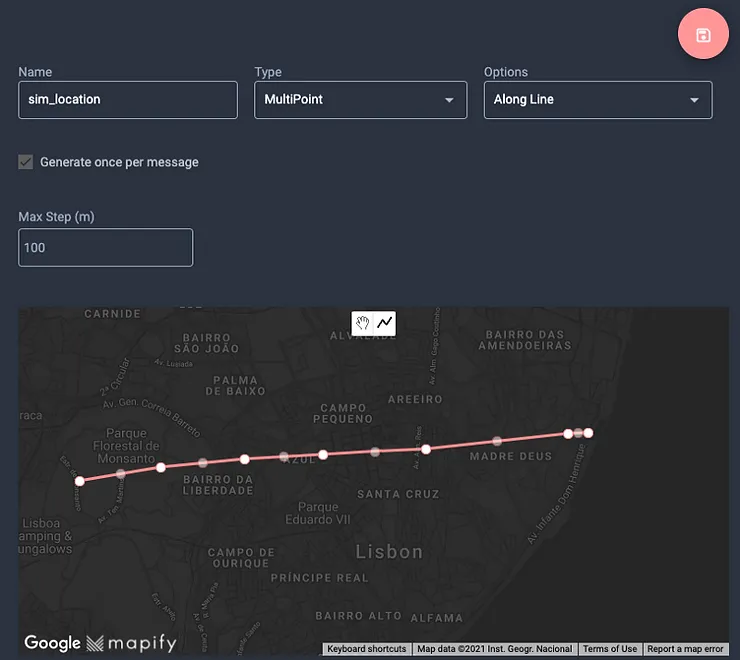
Add a new simulator dynamic variable in the variables list, name it "sim_location", select "MultiPoint" as its type, and "Along Line" from the options list.
Set the Maximum Step as 100, which defines that each position generated won't be further than 100 meters from the previously generated position (depending on the size and location of your restricted zones, you may want to experiment with different step values depending on the distance you want to simulate your vehicles to travel).
Using the line tool in the map preview panel, draw a path that must cross at least one of the restricted zones.
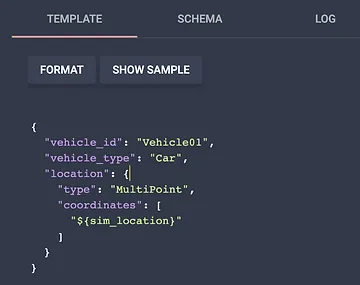
In the location field of the template, replace the "string" value of the type field with "MultiPoint" and the content of the array inside the coordinates field:
{
"_occurrences": 1
}
with
"${sim_location}"
This will tell the simulator to replace the variable reference with the generated values for the vehicle location. Once you are done, your template should look like the screenshot below:
You can click the "Show Sample" to see a possible sample of a generated message.
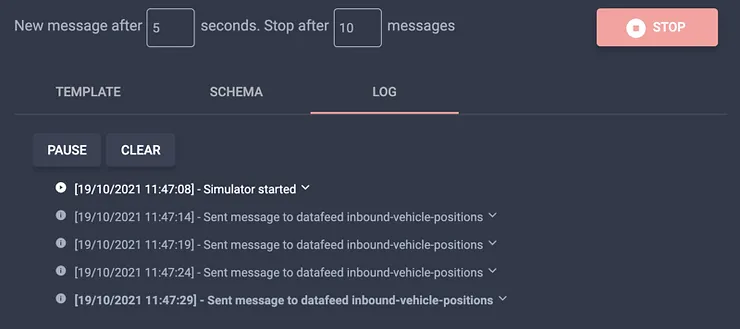
Setup the simulator to send 10 messages, one every 5 seconds:
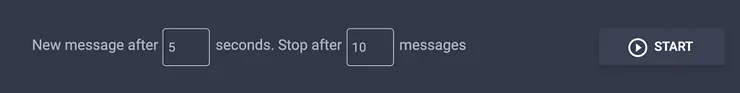
Click the "Start" button and the simulator will start generating messages containing vehicle positions along the pre-defined path line. You can click on the "Log" tab to see the messages process running and confirm the data being sent.
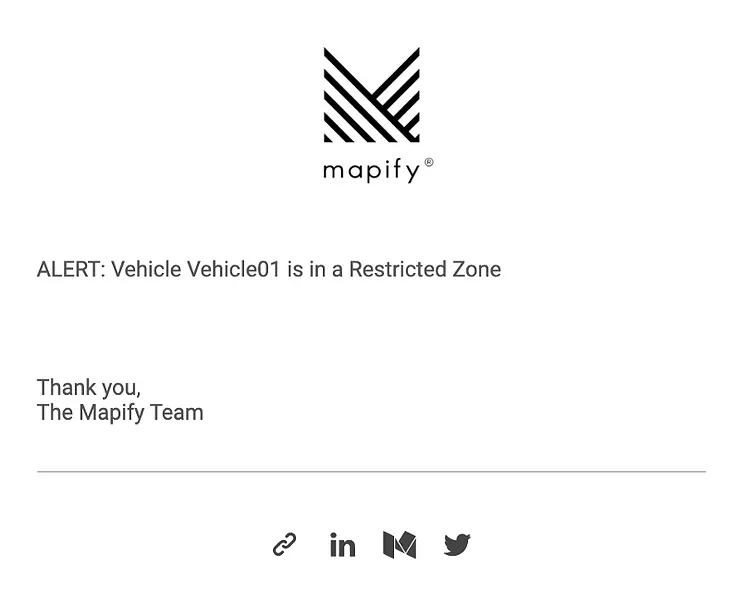
Congratulations, it's working! Whenever a vehicle location is generated inside one of the restricted zones, you will be sent an alert email:
Optional Step - Show the restricted zones transgressions in real time on a map
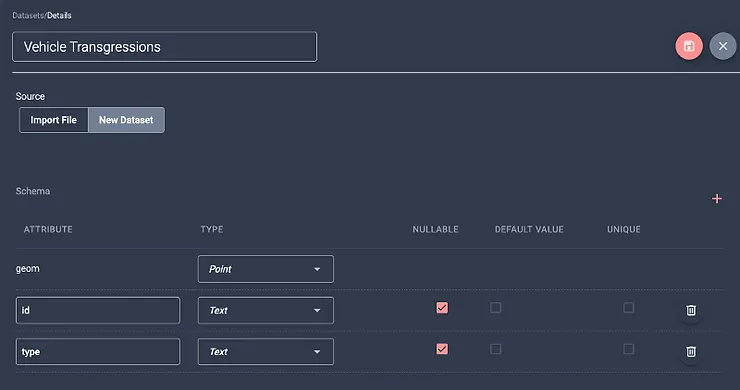
Go back to the browser tab with the open Mapify console. Create a Dataset to hold the vehicle positions which are determined to be inside a restricted zone. Name it "Vehicle Transgressions", select "Point" as the geom type, and add two additional attributes:
- id (text)
- type (text)
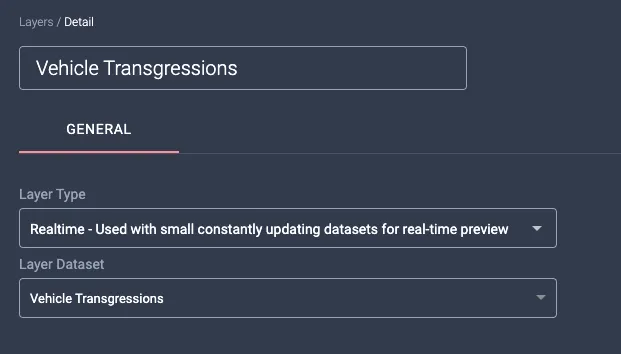
Next, create a real time Layer to render the vehicle transgressions data. Name it "Vehicle Transgressions", select "Realtime" as its type and associate it to the previously created "Vehicle Transgressions" Dataset.
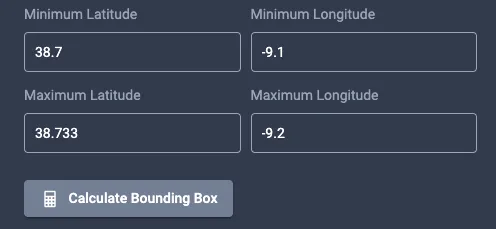
Save your new layer and be sure to update its bounding box to display Lisbon’s city central area:
Minimum Latitude: 38.7
Maximum Latitude: 38.733
Minimum Longitude: -9.1
Maximum Longitude: -9.2
It should look like the screenshot below:
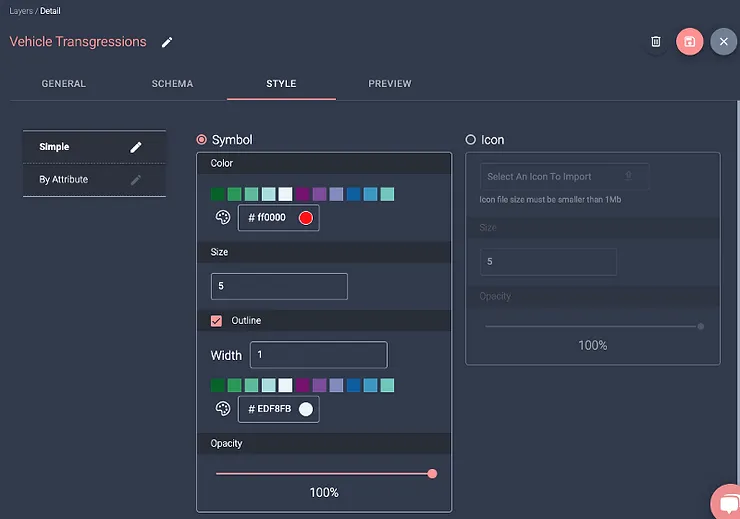
To make it easier to see the transgressions later on the map preview, edit the layer's Style to display the respective points with a red color fill (FF0000) and a light coloured outline (EDF8F8):
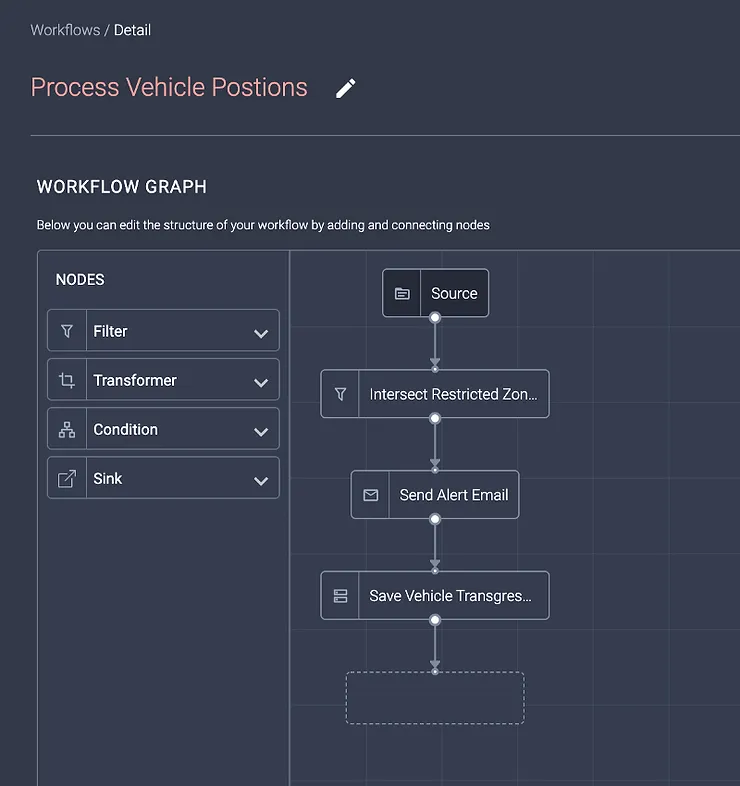
The last step is to update your Workflow by adding a new Dataset Sink node which will be used to save the transgression positions to the recently created Dataset.
Add a new Dataset Sink node to the bottom of the previously created Workflow, name it "Save Vehicle Transgressions", and select the "Vehicle Transgressions" dataset from the list.
Select the message location.coordinates field as the coordinates source for the point to be saved, and the vehicle_id and vehicle_type fields to fill the Dataset's id and type fields, respectively.
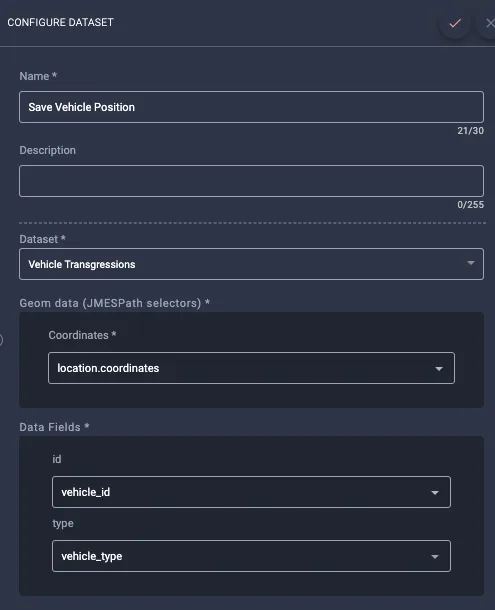
Your workflow should look similar to the screenshot below:
Go back to the simulator browser tab and click the "Start" button again, to generate new vehicle messages.
In the browser tab Mapify console, navigate to the "Vehicle Transgressions" layer and open its preview tab. Zoom in to the central Lisbon area where your vehicle positions will be generated and where the restricted zones were set.
Every time a position is generated inside a restricted zone, the position will be saved to the "Vehicle Transgressions" dataset and displayed in the "Vehicle Transgressions" layer.
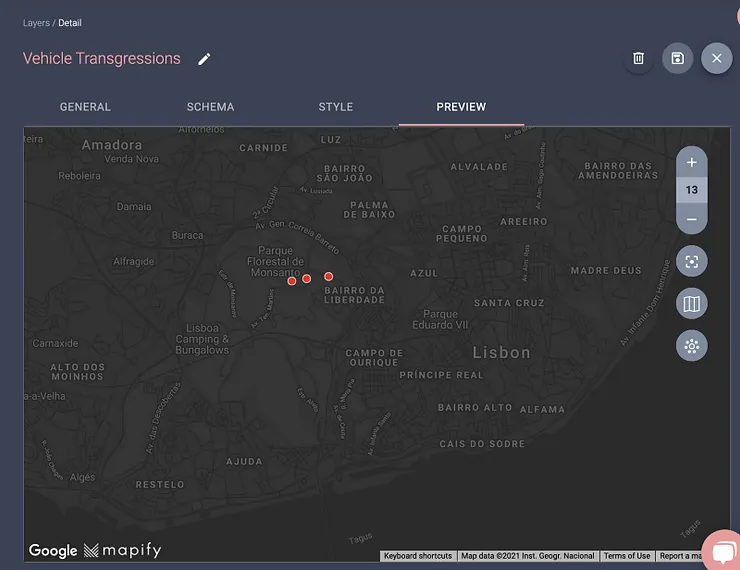
By clicking on any of the transgression points, you will be able to confirm the vehicle's details, such as its id and type.
For an improved visualisation approach, let's create a Map with the restricted zones and vehicle positions to display them in an integrated way.
In the Mapify Console, create a new Map named "Transgressions Map" and add a single layers group named "Geofencing". In that layers group, add the "Restricted Zones" and "Vehicle Transgressions" layers (making sure the transgressions layer is above the restricted zones layer).
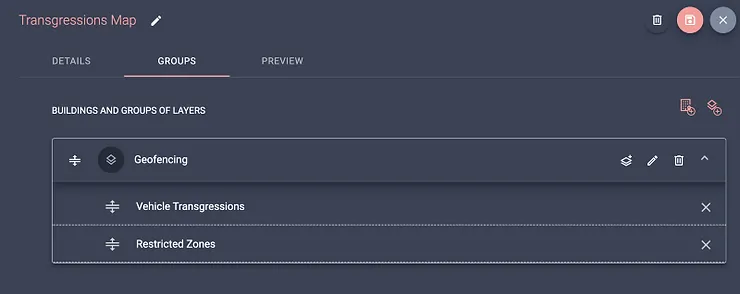
Be sure to have Mapify automatically calculate the map's bounding box values in the "Details" tab by clicking on the "Calculate Bounding Box" button, and save the new Map.
Now, when you run the simulator, you will be able to see the transgressions represented over the restricted zones in real time in the Map preview tab.
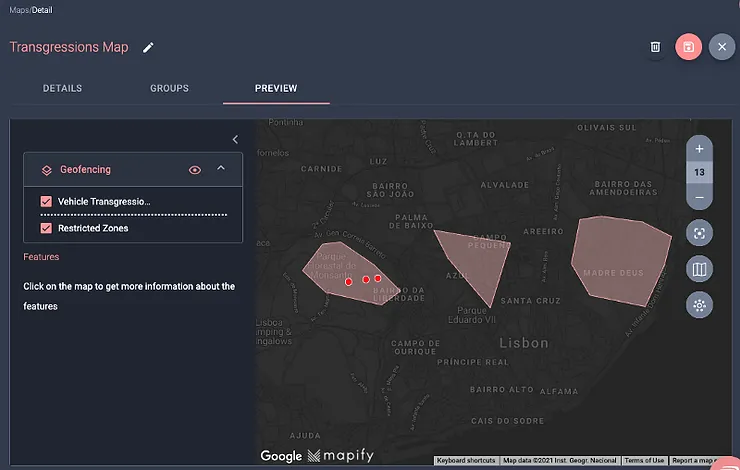
You are done !!
You can still improve this geofencing example by using additional Workflow nodes, such as a Transformer node to obtain details of the intersected restricted zone, a Condition node to process non-transgression positions with some other rules, or even an HTTP Sink node to send alerts to your own systems. You can also use use vehicles with additional attributes, you can style the vehicles according to their transgression status, and even use the simulator to simulate several moving vehicles of different types, for example. Feel free to reach out to our team for help in using Mapify to best fit your business requirements.
I hope you enjoyed this walkthrough and can now see how flexible and powerful Mapify can be!

.jpg)
.jpg)
.webp)