Build a simple but effective IoT monitoring solution with ZigBee devices and Mapify
October 13, 2021
Mário Sobral
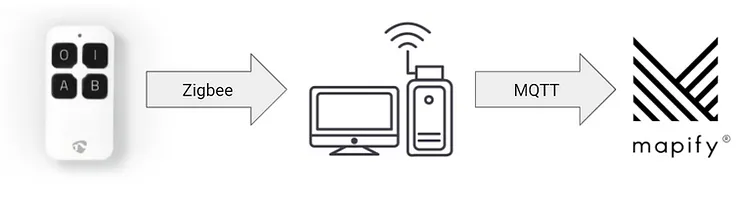
In this post we’ll show yo how you can use regular ZigBee connected devices, Zigbee2MQTT and Mapify Workflows to build a simple but effective Internet Of Things monitoring solution. And all of that without having to write a single line of code!
ZigBee connected devices integration and monitoring with Mapify Workflows
Requirements:
- Mapify account (you can request a trial account here)
- One Zigbee2MQTT compatible ZigBee adapter
- One Zigbee2MQTT compatible device(s) that transmits data (so, not a a smart light bulb please :-)
It is not the purpose of this article to explain or deep dive into the ZigBee specification, so we will assume you have some prior knowledge or you have read up a bit on the topic already, even though it is not really required to follow this example.
If you want to dive right in the deep end without following this tutorial, feel free to request a Mapify trial here, or click here to schedule a talk with us, and start creating your location intelligence solutions today!
As per the requirements, this walkthrough makes use of:
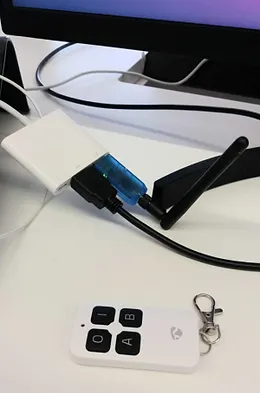
- ZigBee adapter: Slaesh’s CC2652RB USB stick
- ZigBee device: Nedis ZBRC10WT 4-button security remote control
NOTE: Neither me or Mapify have any relationship, affiliation or business with Slaesh or Nedis. It just happened that those were the easiest to buy and ship to Portugal in my case.
Here’s what they look like, on my desktop:
This walkthrough you will have the Nedis remote play the part of the IoT sensor(s) that submits live data to Mapify, which will then process the data in real time through a Workflow to update data in a Dataset and send specific email notifications to the user.
Create a Data Feed in Mapify to handle incoming real time data from the sensor(s)
The first thing you should do is to create a Mapify Data Feed to handle incoming data from your ZigBee network sensors. Open Mapify Console and create a Data Feed named zigbee.
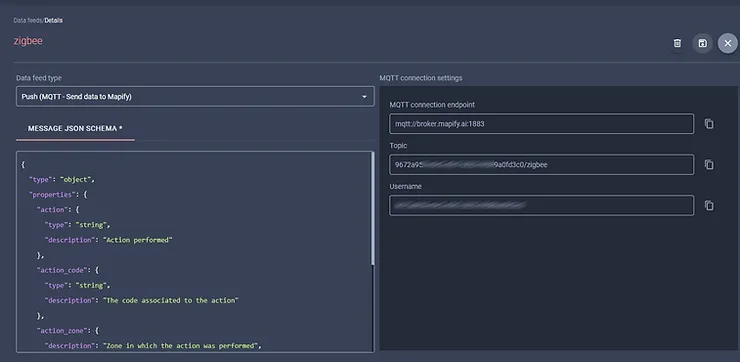
For the Nedis ZBRC10WT 4-button security remote control, I had already confirmed its message JSON schema as:
{
"type": "object",
"properties": {
"action": {
"type": "string",
"description": "Action performed"
},
"action_code": {
"type": "string",
"description": "The code associated to the action"
},
"action_zone": {
"description": "Zone in which the action was performed",
"type": "integer",
"minimum": 0
},
"linkquality": {
"description": "Quality of the connection link",
"type": "integer",
"minimum": 0
}
}
}
Keep in mind that you will need this Data Feed’s connection details later in this, in order to configure Zigbee2MQTT to send messages to it. And remember that the password for the MQTT topic will need to be a Mapify API Key that you should have generated with the necessary permissions (read our previous walkthroughs to learn more about Data Feeds and Workflows).
Run your own Zigbee smart devices network
The next thing you’ll do is to setup your Zigbee adapter and device(s), so that you can have the devices sending data to the adapter.
For the Slaesh’s CC2652RB USB stick that I use in this example, just follow the installation instructions to update its firmware with the Coordinator firmware image. Even if you have more Zigbee adapters laying around, keep in mind that you should only have one coordinator device active in your Zigbee network.
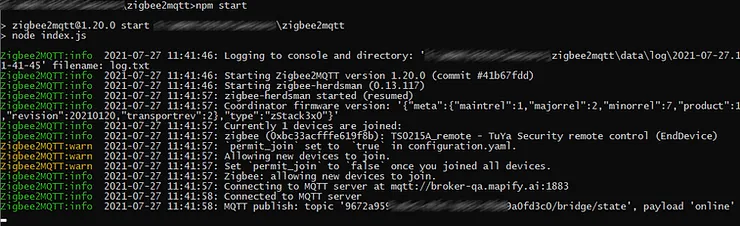
Make sure the Slaesh’s CC2652RB USB stick is connected and powered by one of your machine’s USB port. Follow these instructions to identify the port the USB adapter is connected to, install and configure Zigbee2MQTT in your machine. When configuring the Zigbee2MQTT broker settings in its configuration.yaml file, be sure to specify Mapify’s MQTT broker URL, topic and the necessary credentials.
You should be able to have Zigbee2MQTT running in your machine now, and it should look something like this:
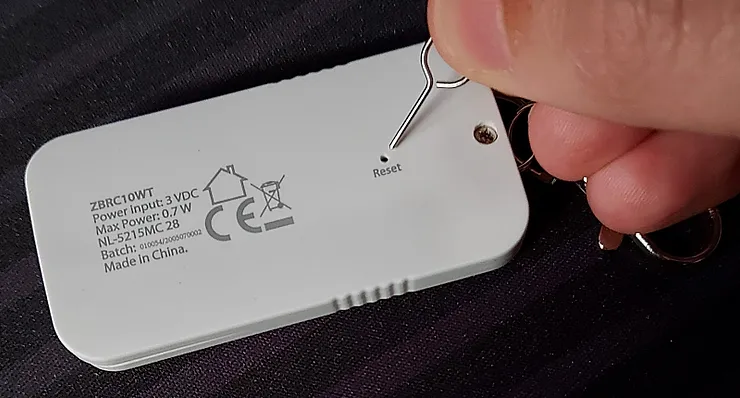
The next step is to have the Nedis remote send data to the adapter when its buttons are clicked. For that to happen, you need to pair the remote with your adapter. Follow these instructions for pairing devices with a Zigbee adapter, but for the Nedis remote I used, it is as simple as resetting it while near the adapter.
Test the connection by making sure Zigbee2MQTT is running and click on one of the buttons on the remote. Check your machine’s console output, to confirm the message and its payload were received by the adapter:
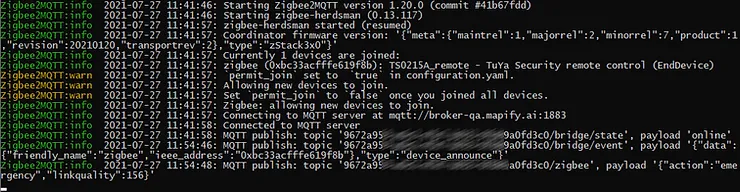
This is what the payload for the different Nedis remote control buttons look like for me:
Button 0:
{"action":"emergency","linkquality":138}
Button 1:
{"action":"arm_all_zones","action_code":"","action_zone":23,"linkquality":135}
Button A:
{"action":"arm_day_zones","action_code":"","action_zone":23,"linkquality":135}
Button B:
{"action":"disarm","action_code":"","action_zone":23,"linkquality":180}
This is great!!! We have our own ZigBee network of devices sending real time messages to our adapter, which then relays them to a Mapify Data Feed!
Setting up Mapify to handle the real time data from your Zigbee network
Now all we need to do is to tell Mapify what to do with the incoming data.
Since we want to make changes to a Dataset as messages arrive, we’ll create:
- Dataset to hold data we want to update
- Realtime Layer associated to the Dataset to render changes in real time
- Workflow to handle and process incoming messages
For this example, I imagined a stadium with four entrance gates (to be able to map the four buttons of the Nedis remote to each gate :-), for which we will be detecting alert events (clicks of the remote buttons).
Keep in mind that there are thousands of different Zigbee devices which provide all kinds of data, from alarms and intrusion detection, motion, gases and smoke detectors, temperature and humidity values, buttons and switches. Even though this example uses just a simple four-button remote to send data, you can build much more complex and business oriented IoT solutions just as easy.
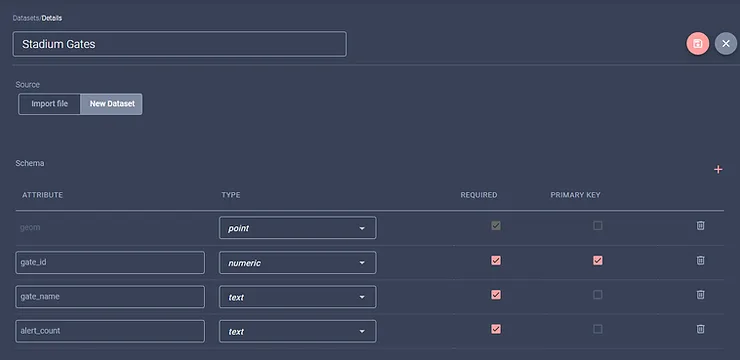
Go to the Mapify Console and create a point based Dataset which will hold our fictional stadium gate information. Name it Stadium Gates and add a gate_id numeric attribute (set it as the primary key), a gate_name text attribute and a numeric alert_count attribute, as illustrated below:
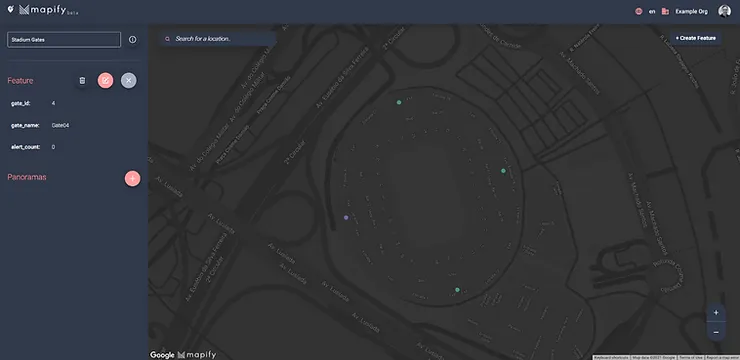
After the Dataset is saved and available in the Datasets list screen, click on it to open its details page. Then click on the “Edit data on Mapify Editor”. In the Mapify Editor preview map, zoom in to an area in which you will create four point features that will simulate our gates location (I zoomed in to an actual stadium location, which makes this example look really nice). Give each gate a different gate_id, a different gate_name and set their initial alert_count attribute to 0, as per the table below:
gate_id gate_name alert_count
----------------------------------
1 Gate01 0
2 Gate02 0
3 Gate03 0
4 Gate04 0
You can read our previous article regarding creating and editing features in Mapify Editor to learn how to create these fictional gates.
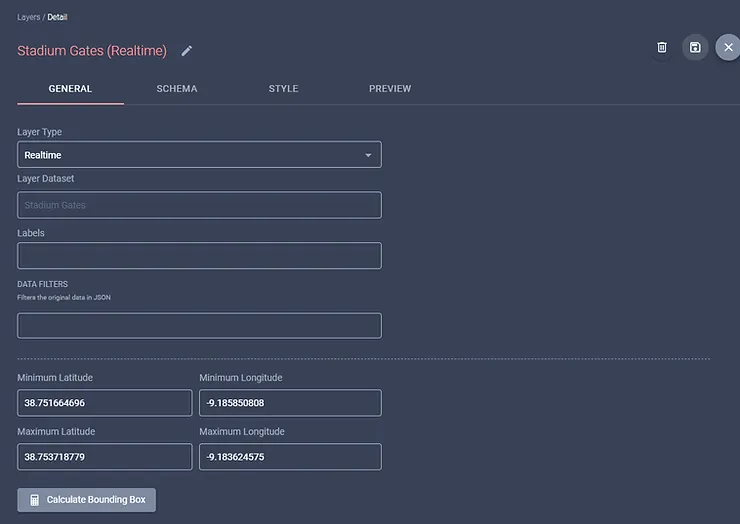
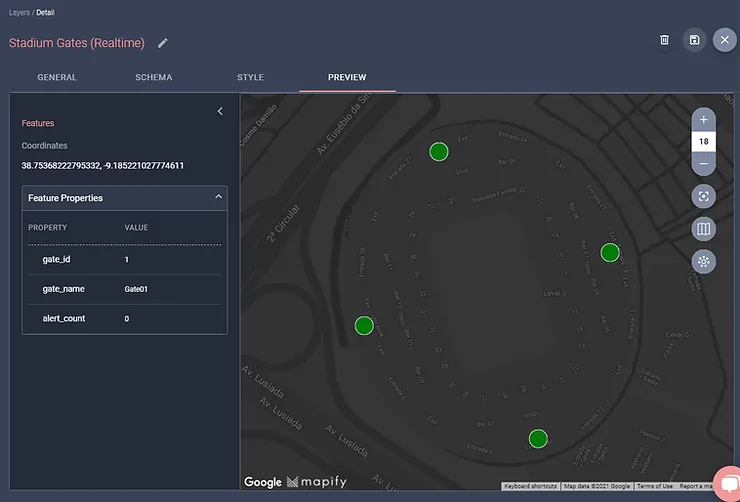
Don’t forget to publish the Dataset once you have created the gate features, to make them available for layer creation. Since we have our Dataset already, let’s create a Realtime Layer based on the Stadium Gates dataset which will be able to render changes to the data in real time. It should look something like this:
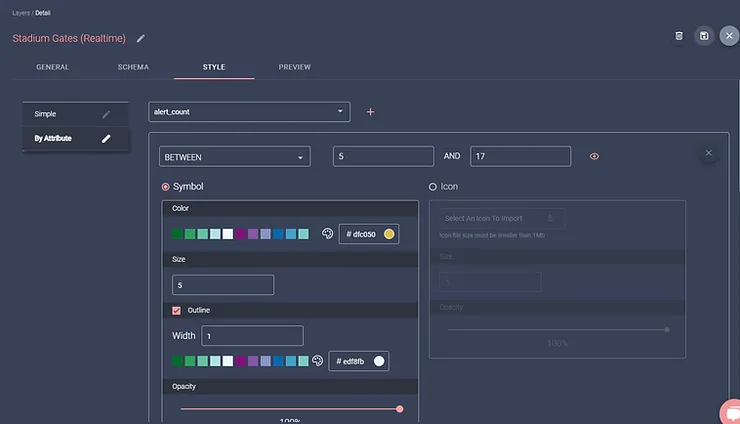
In the Style tab, click on the “By Attribute” style button and select the alert_count field name from the dropdown list. Add the following conditional styling rules:
OTHER
Symbol = Color: #06790c and size: 15
Outline = Color: #edf8fb and width: 1
alert_count BETWEEN 5 AND 10
Symbol = Color: #dfc050 and size: 15
Outline = Color: #edf8fb and width: 1
alert_count GREATER THAN 10
Symbol = Color: #f30505 and size: 15
Outline = Color: #edf8fb and width: 1
You can click on the “Preview” tab to preview the four gates you created earlier:
Next, let’s create a Workflow which sends an email notification and increments the alert_count attribute of one of the gates depending on the button pressed on the Nedis remote control.
If you haven’t created a Workflow yet in Mapify, please read one of our previous articles regarding the creation of Workflows in Mapify, and then come back to continue building this example.
In the Mapify Console, create a Workflow and set its Source to the zigbee Data Feed created earlier in this article for handling the messages sent from the Zigbee2MQTT service.
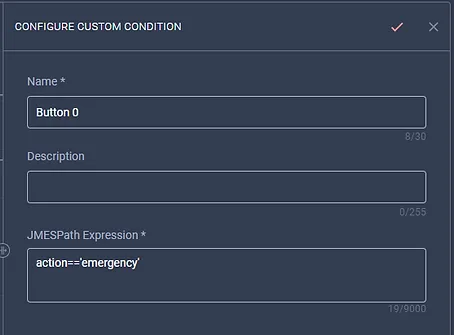
Add a Custom Condition node below the Source node, and name it “Button 0”. By checking the payload information provided for each button earlier in the article, we can identify a press of the “Button 0” on the remote by an “emergency” value in the “action” attribute of the received message. So, in the JMESPathExpression input box of this node, type:
action=='emergency'
It should now look like the illustration below:
On the Yes branch of this node, add an Email Sink node, with the title “Button 0 pressed”, and add your email to the list of target email addresses. You can add text to the body of the email. Let me suggest something like:
Message received from Button 0:
Action: ${action}
Code: ${action_code}
Zone: ${action_zone}
Link Quality: ${linkquality}
For the No conditional branch, add another Custom Condition node, and name it “Button 1”. We can identify a press of the “Button 1” on the remote by an “arm_all_zones” value in the “action” attribute of the received message.
You should now be able to fill in the respective JMESPath expression for this node and add nodes to the Yes and No branch just like previously, but now targeting the Button A and then for Button B.
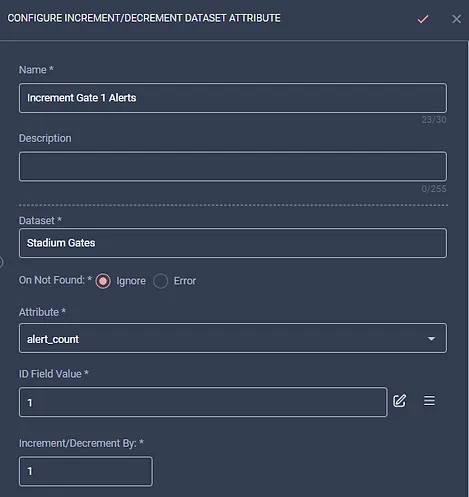
Once you have added all the increment nodes to your workflow, it should look something like the illustration below:
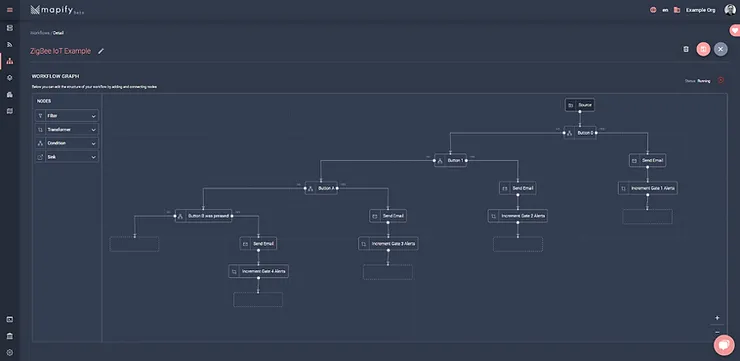
Simply put, the workflow above simply checks the incoming messages for the action attribute value and determines which email to send and which Dataset feature will have its alert_count value incremented.
Now you’re ready to start sending those messages from the ZigBee remote and process them in your Mapify workflow!
Once you start clicking on those buttons this is what to expect:
- An email will be sent specifying which button was pressed on the remote
- The associated Dataset feature (“stadium gate”) will have its alert_count value incremented by 1 (for each button press)
- Once one of the “stadium gate” reaches one of the style thresholds, it will automatically change its style according to its alert_count value
Here’s a quick video showcasing what to expect as a user simulates “gate sensors” triggering, by pressing on the remote buttons (your results may vary depending on which buttons and how frequently you press them):

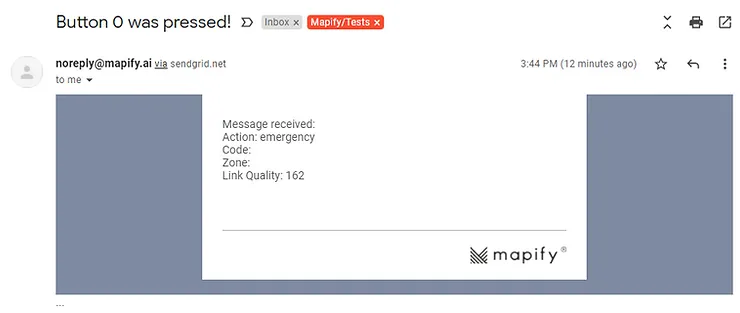
If you specified your email address in the workflow, you will be getting an email for each button press:
I hope you enjoyed this walkthrough and can now see the amazing and powerful editing abilities of Mapify!
Ready to power your solutions with Mapify? Feel free to request a Mapify trial here, or click here to schedule a talk with us and we’ll show you what Mapify can do for you and your business.

.jpg)