Data Visualization in under 5 minutes using Mapify's Connector for Google Looker Studio
December 21, 2023
Ana Guerra
.webp)
We're thrilled to announce that our Google Looker Studio Connector has finally been approved and is now officially available as a Partner Connector. This powerful connector lets you enhance your data reporting and visualization experience the Mapify way - with just a few clicks, no coding required.
Google Looker Studio, previously known as Data Studio, is a free business intelligence reporting tool, which unlocks the power of your data by making it easy to create interactive dashboards and compelling reports from a wide variety of sources, driving smarter business decisions.
Automatically add your data
With our new connector, you can effortlessly add your Mapify Dataset to Google Looker Studio. This automated integration streamlines your workflow, giving you the freedom to choose the exact data you want to feature in your reports.
Build your own custom visualizations
One size doesn't fit all, and we get that. Mapify's Connector empowers you to build custom data visualizations within Google Looker Studio. Select specific fields from your Mapify Dataset to create visualizations that align perfectly with your unique business needs.
Enrich your reports
Data is richer when paired with context. Enrich your reports by combining Mapify data with insights from other third-party sources. Google Looker Studio becomes the canvas where you paint a comprehensive picture of your business.
Easily share your reports
Collaboration is key. Share your custom reports effortlessly with your clients or other stakeholders. Mapify's Connector simplifies the sharing process, ensuring that your insights reach the right audience at the right time.
How do I get started with Mapify's Connector for Google Looker Studio?
Getting started with our Google Looker Studio Connector is easy!
1. Generate a Mapify API Key
Before you start, ensure you generate a Mapify API Key in the Mapify Console with at least Dataset read permission.
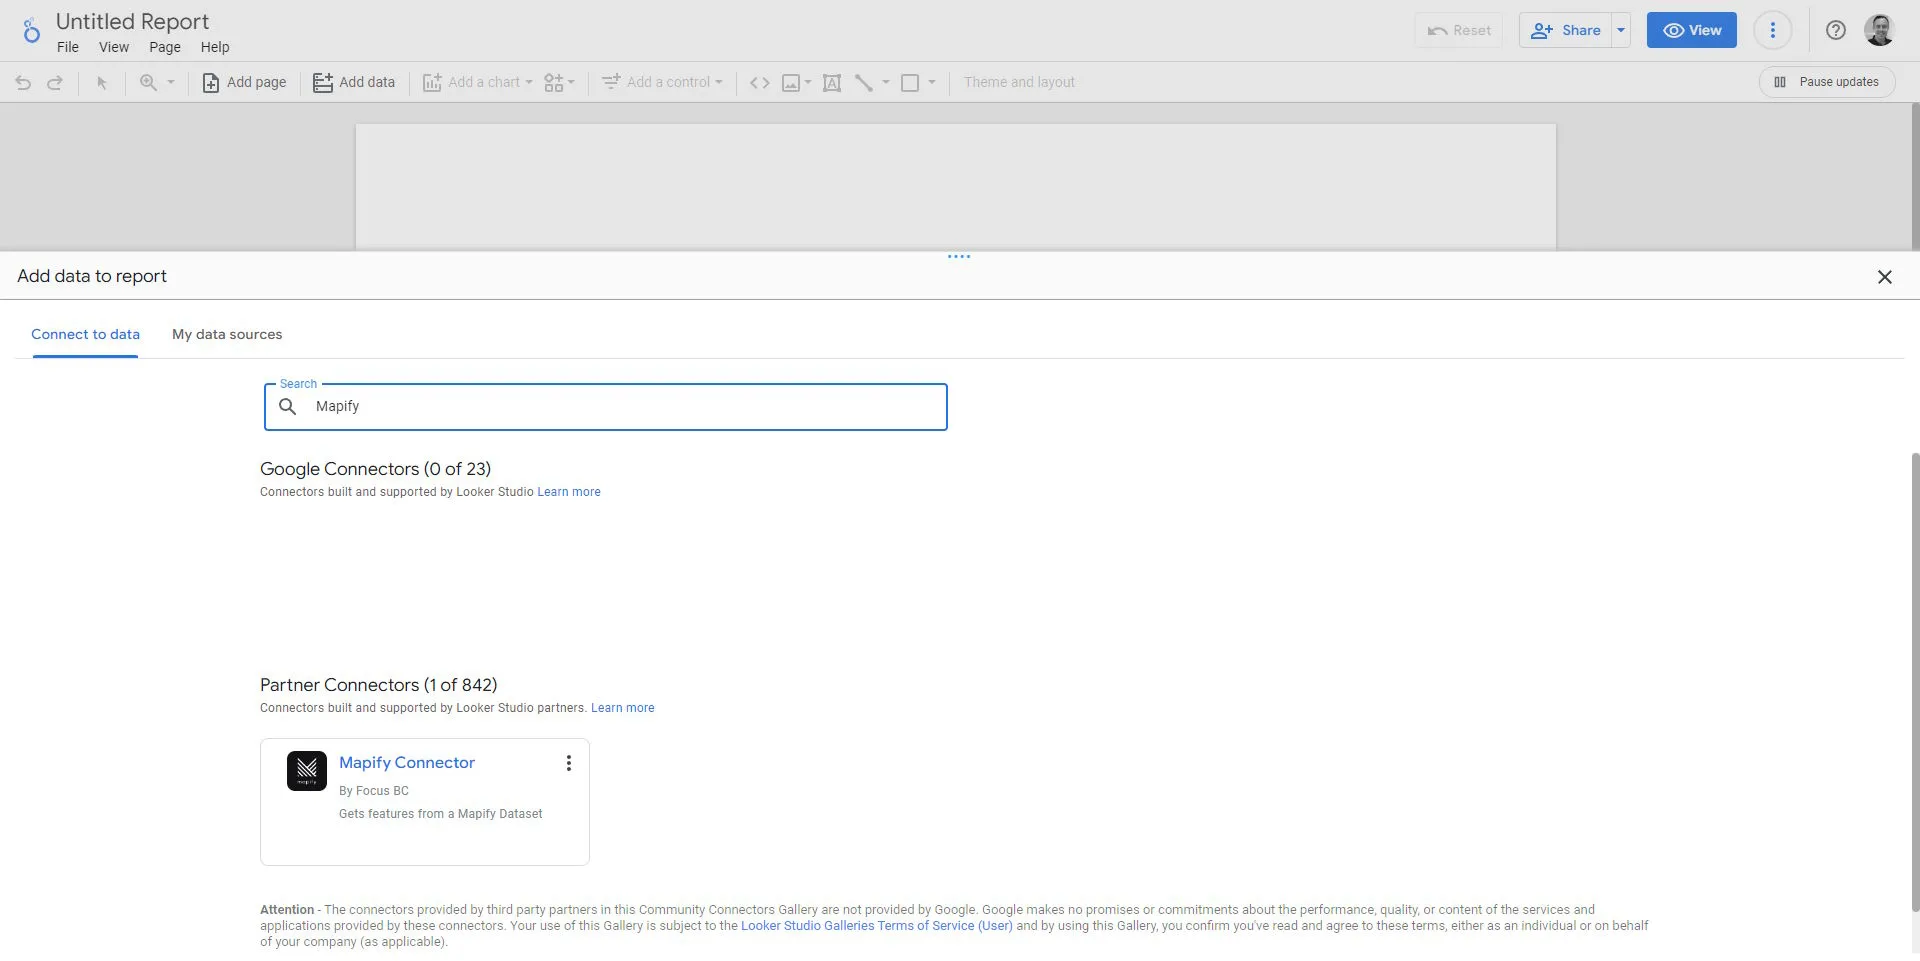
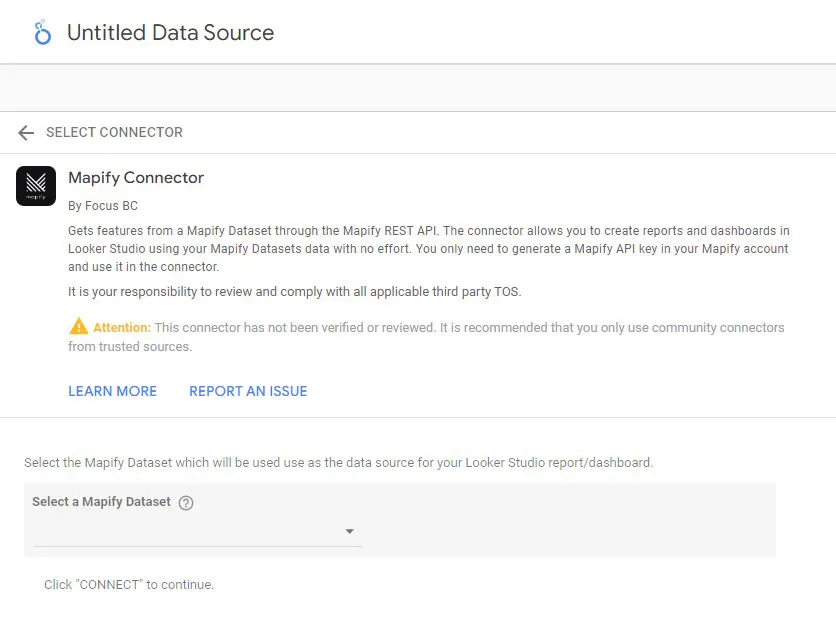
2. Add a new data source in your report
Open Looker Studio and add a new data source. Choose the Mapify Connector from the list of esteemed partner connectors.
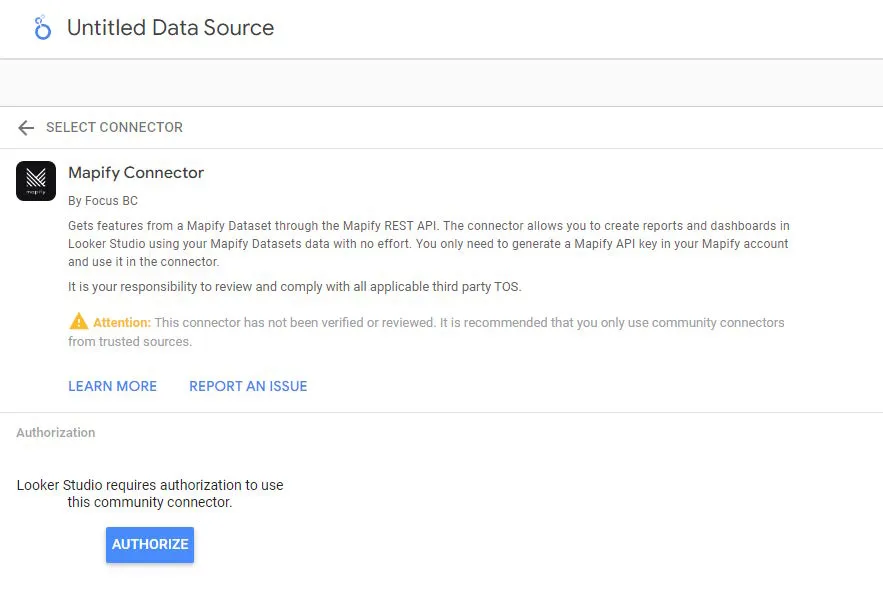
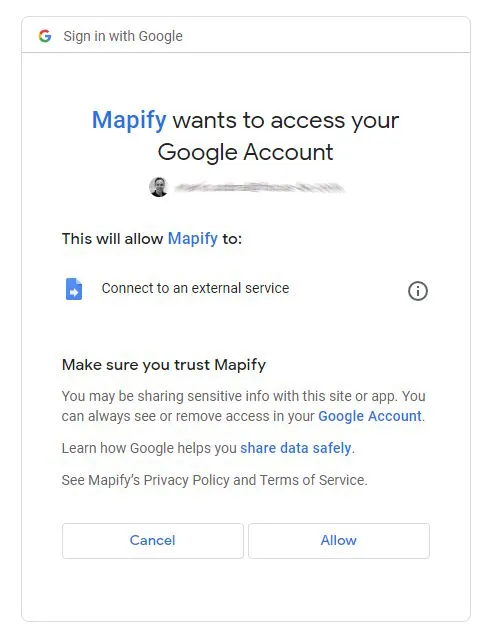
3. Authorize the Connector
Click "Allow" to let the connector access the Mapify API seamlessly from your Google Looker Studio report.
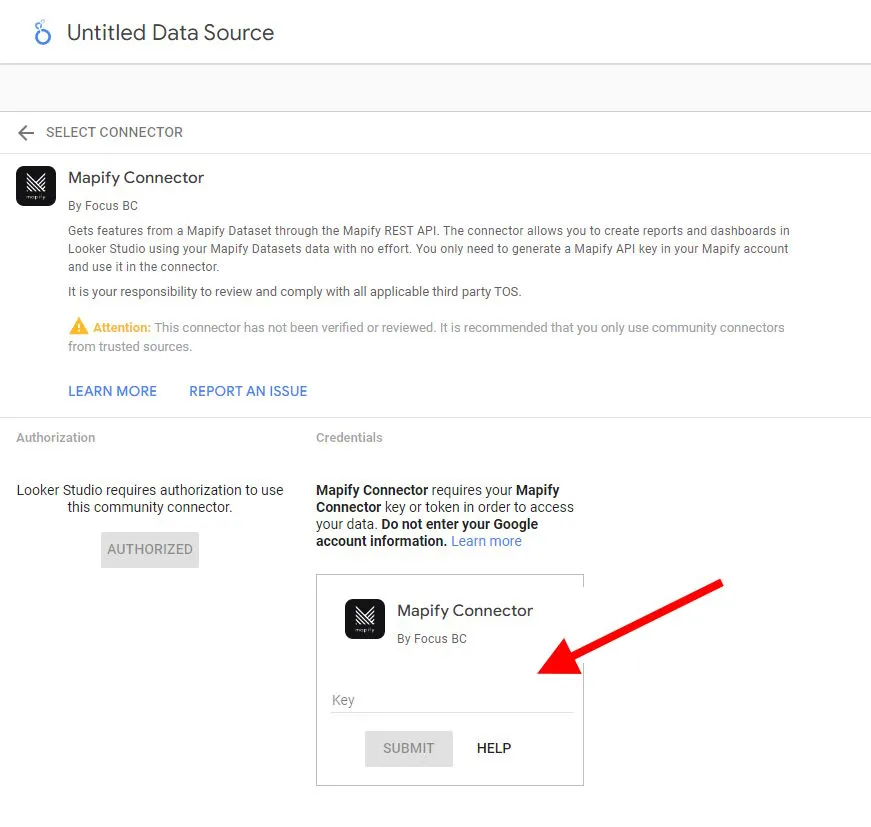
4. Provide your Mapify API Key
Provide the Mapify API Key you generated earlier, ensuring it has Dataset read permission.
5. Select the Mapify Dataset
Choose the Dataset that will be the heartbeat of your report. The connector will connect to this Dataset.
6. Configure which fields to include
Tailor your report by choosing the fields you want to include. Add descriptions, specify default aggregation methods - make it yours!
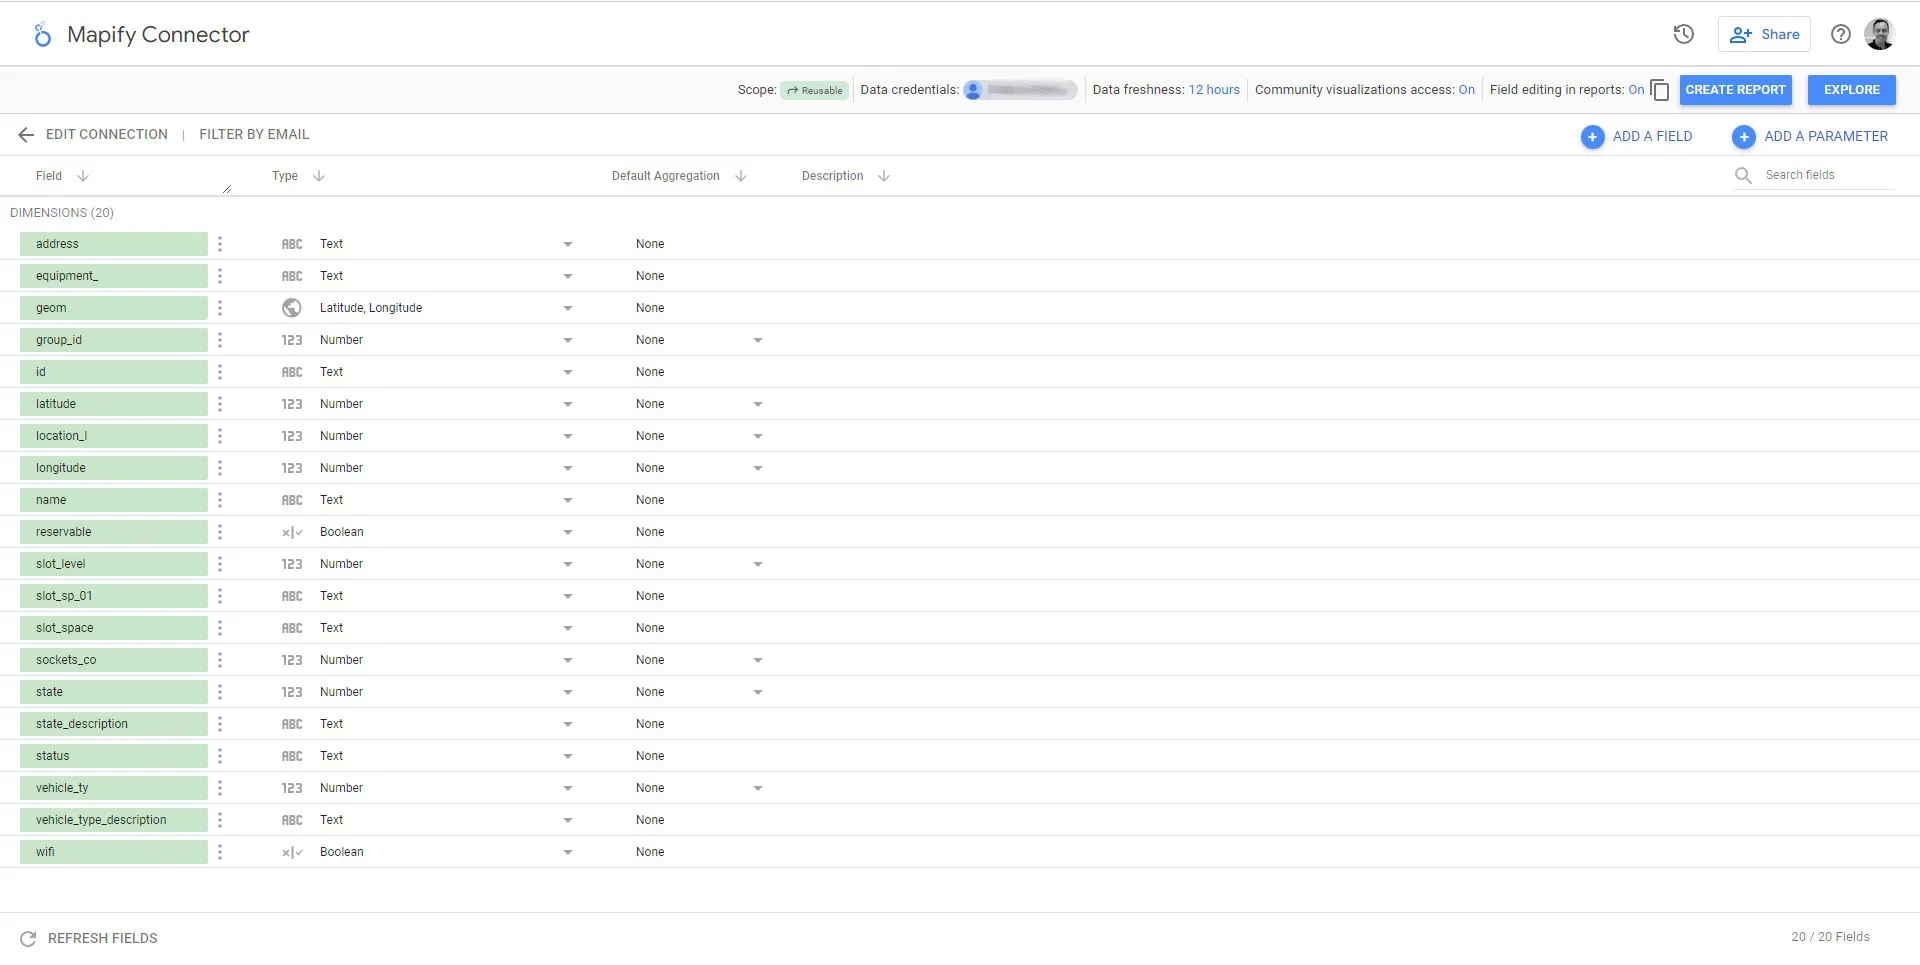
7. Explore and build your report
Congrats! You've successfully integrated Mapify's Google Looker Studio Connector. With everything set up, it's time to explore your data. Add charts, visualize insights, and understand the narrative behind your business.
Curious about the process behind building the Google Looker Studio report for Barcelona's electric charging stations? Explore our latest article for an in-depth walkthrough.
Also, take a look at this step-by-step guide, we'll take you through the process of bringing real-time data from Barcelona’s EV charging stations into Looker Studio. You'll learn how to create an API Key, add the Mapify Partner Connector, select a dataset, and customize your dashboard to extract meaningful insights. This tutorial is designed to help you transform raw data into actionable intelligence with ease.
Haven't got a Mapify trial yet? Get yours now! Plus, keep an eye out for our upcoming tutorial video that will guide you through this setup process and show you more of what you can do with Google Looker Studio.