
Display environmental sensor data in 5 steps using Mapify and Sensor.Community
March 15, 2024
Mário Sobral
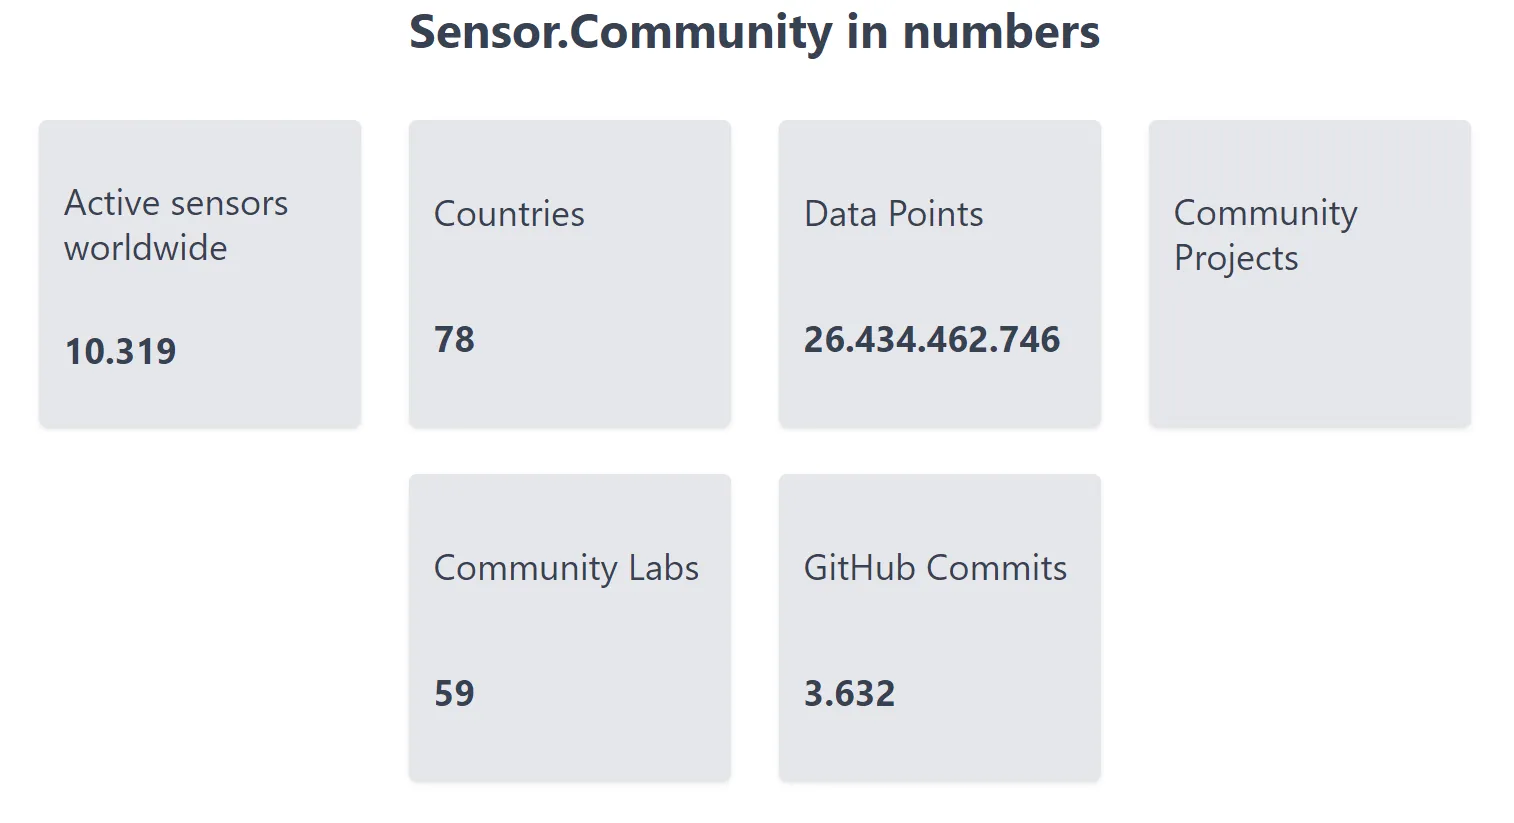
Sensor.Community is a contributors-driven global sensor network that creates environmental open data. Their mission is to inspire and enrich people’s lives by offering a platform for the collective curiosity in nature that is genuine, joyful, and positive.
The Sensor.Community contributors currently share data from over 12,000 active sensors across 82 countries, making it a sizable source of sensor data. Data ranges from temperature, humidity, and atmospheric pressure to several air quality indicators, such as PM10 and PM2.5, among others.
This plethora of data made available makes it a great use case for how Mapify can provide an easy no-code approach to handling, processing, and visualizing large amounts of sensor data in real time.
This article will walk you through configuring Mapify to obtain the sensors' data, process it through a workflow, and display it on a map.
The Sensor.Community API
Beyond providing information on how contributors can build their own sensors and provide data to Sensor.Community, there is also a public API which provides access to the sensor data with a simple GET request.
This article focuses on V2 of the API and will use the endpoint which provides data for all measurements per sensor, of the last 5 minutes (for all sensors).
The following sections will detail how you can use Mapify to quickly build a prototype that obtains all the sensor data from the Sensor.Community public API, processes it through a workflow (you can configure it by adding your own specific rules), and displays the data over a map that you can share with your friends and colleagues.
1. Create a Dataset to hold the latest sensor values
The first step is to create a Dataset to hold the latest sensor data. By taking a look at the JSON returned from the API and finding all the possible types of sensor data values, it is possible to understand which are the fields that our Dataset needs to include.
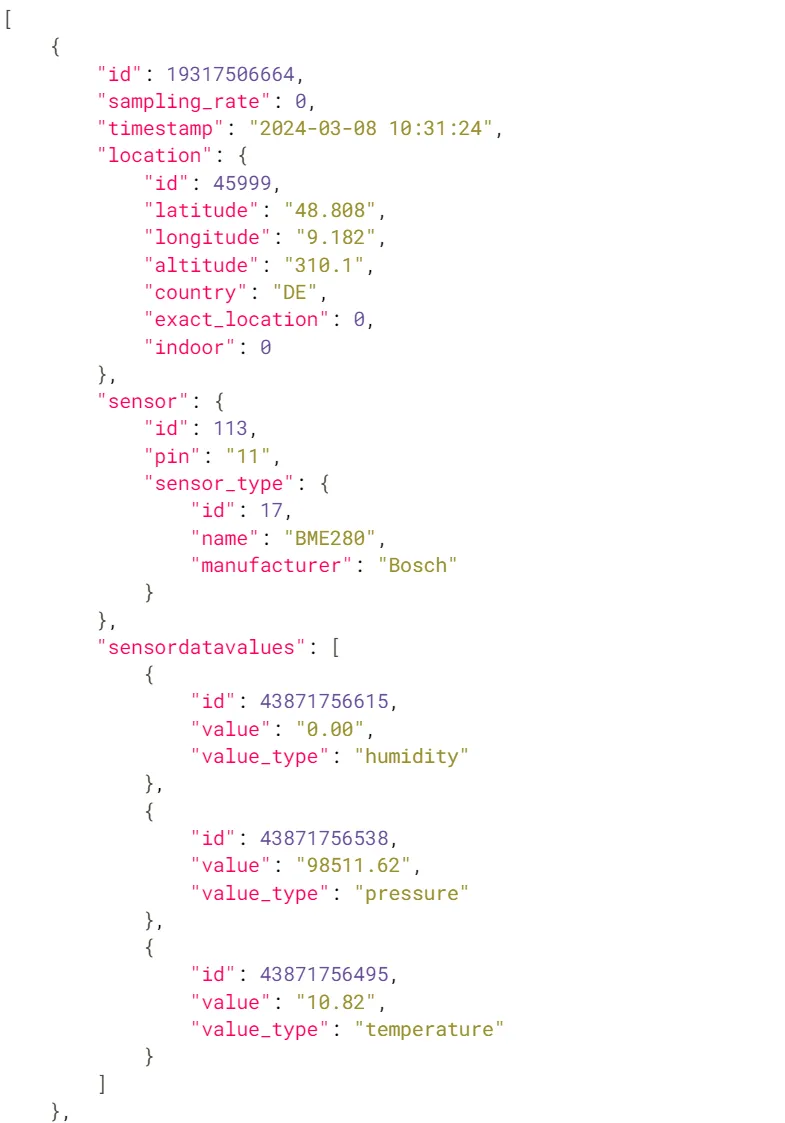
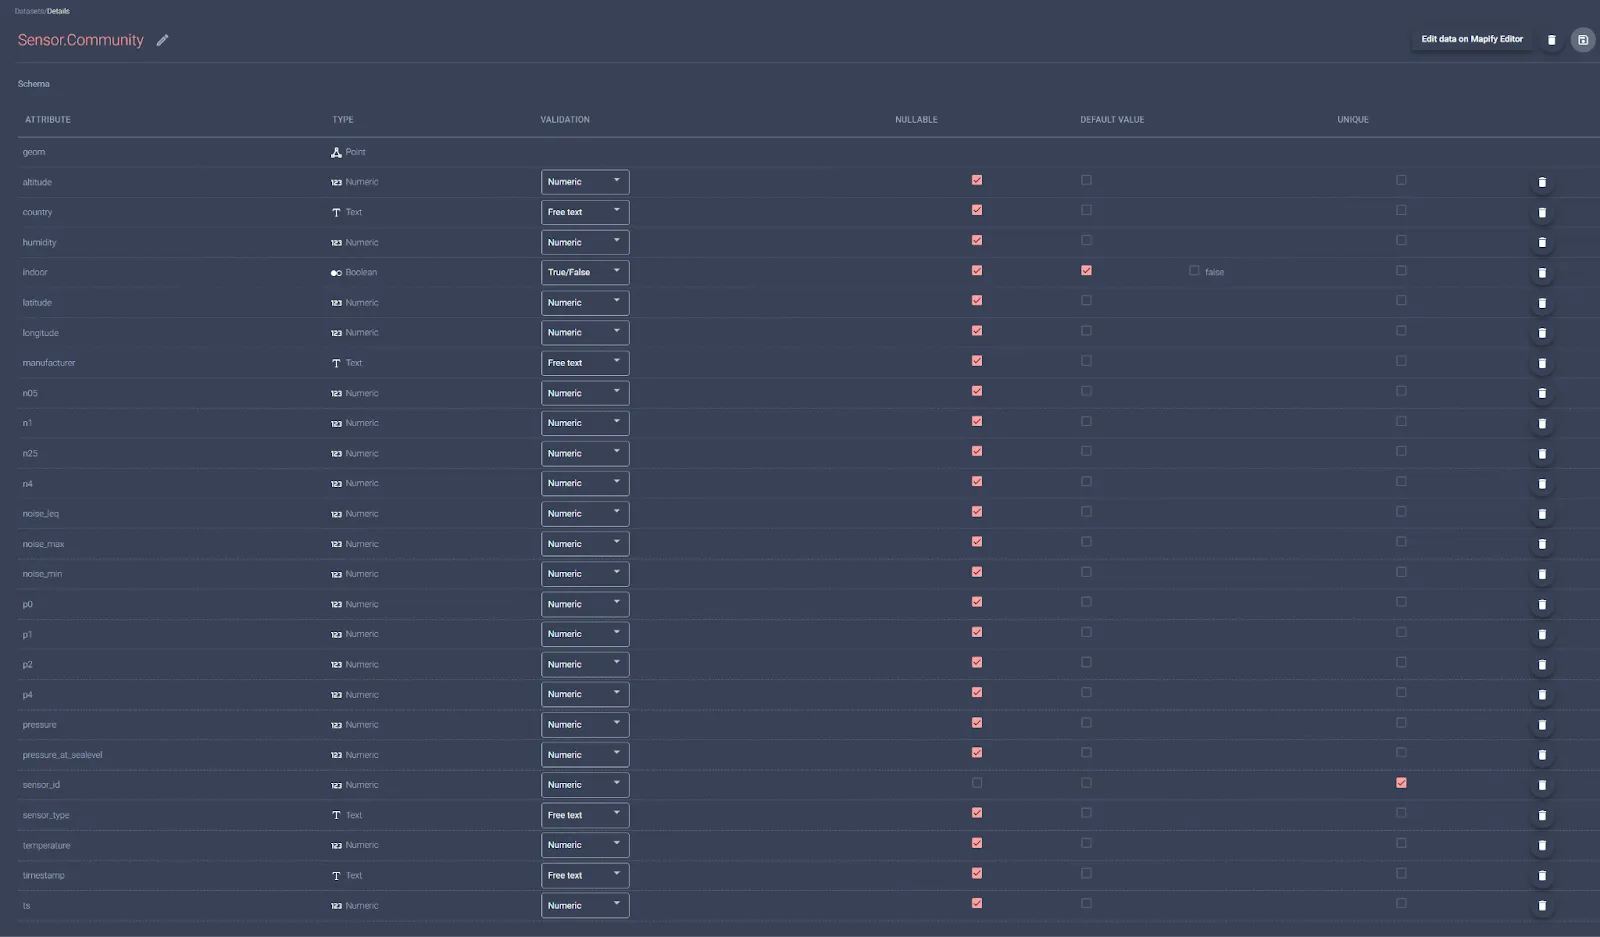
A valid dataset to hold all the information from the sensors could look like the illustration below. Make sure you have a unique field to hold the identifier of each sensor, which in this case is numeric, as per the above data example.
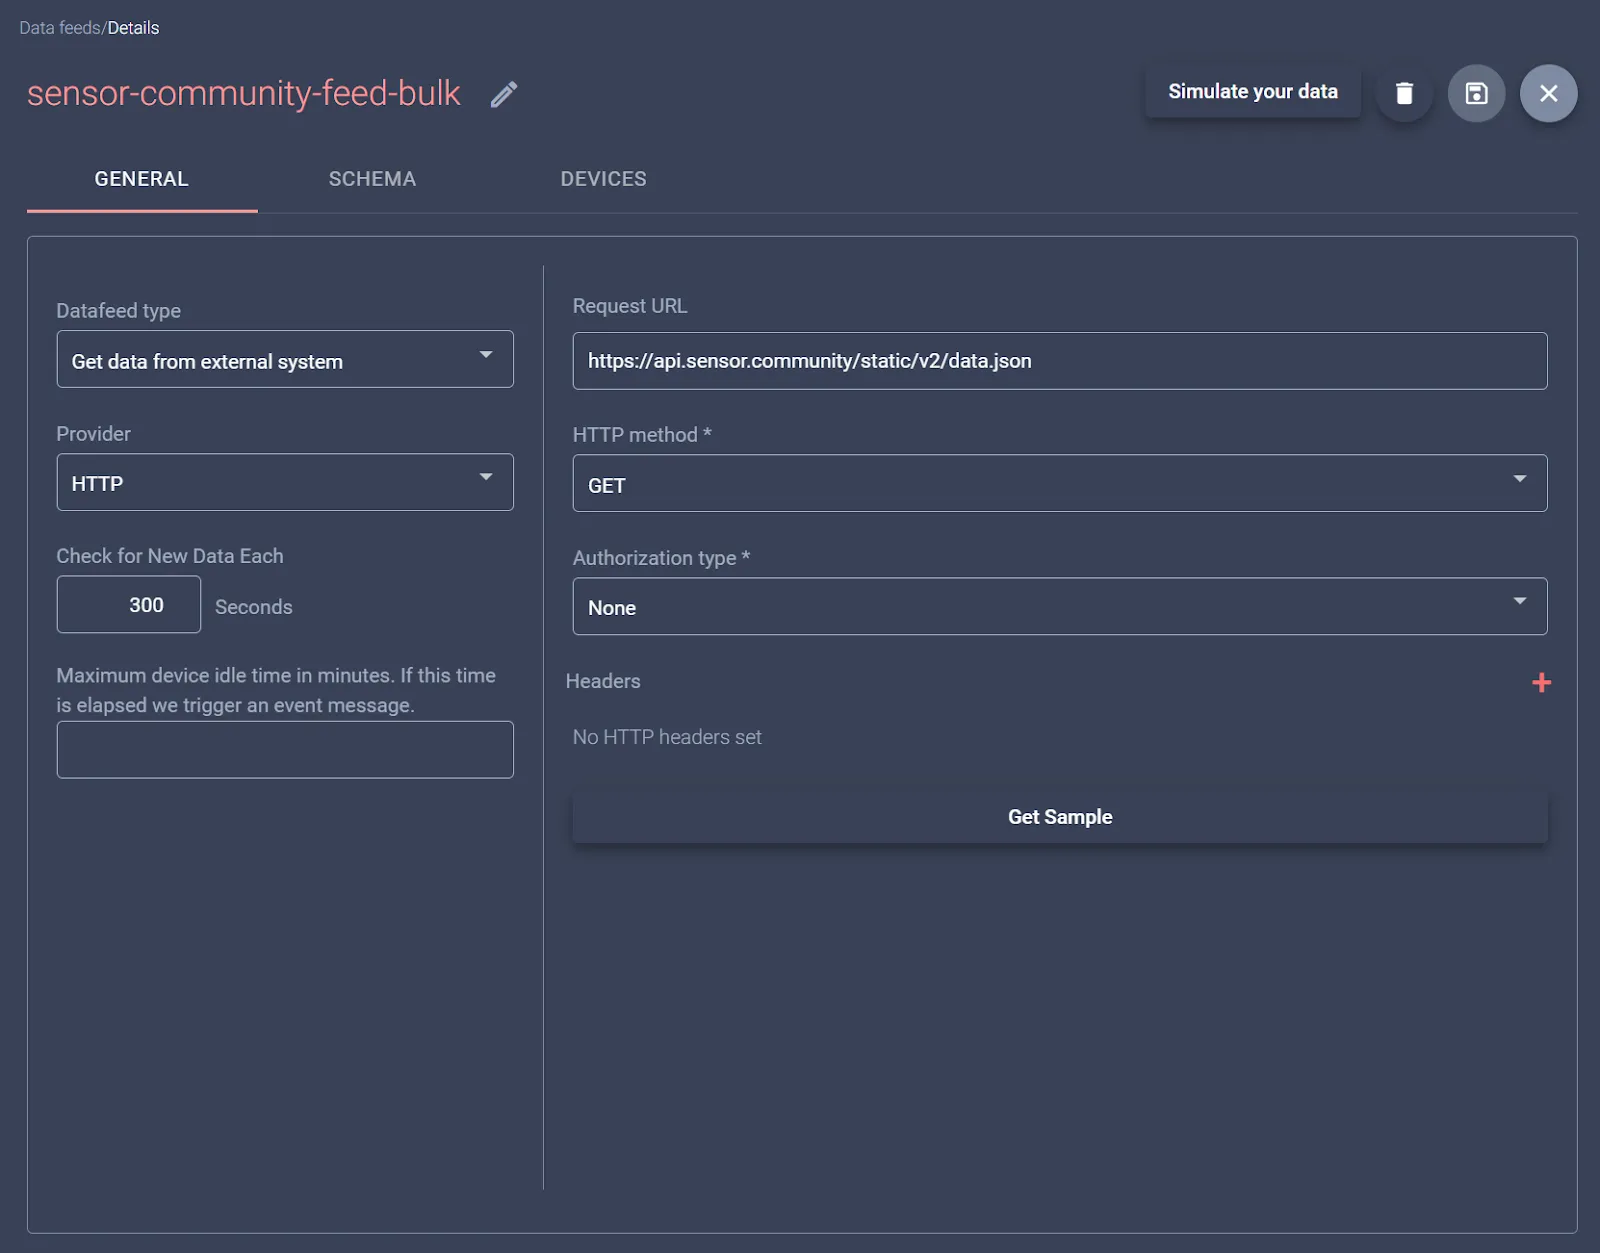
2. Obtain the sensor data through a Data Feed
The next step is to create a Data Feed which will invoke the API endpoint and obtain all the measurements of the last 5 minutes from all the sensors.
Just set up a Data Feed to “Get data from external system” through HTTP, make it run every 300 seconds (the 5 minutes for which data is up to date), and configure the GET request with the API’s endpoint: https://data.sensor.community/static/v2/data.json
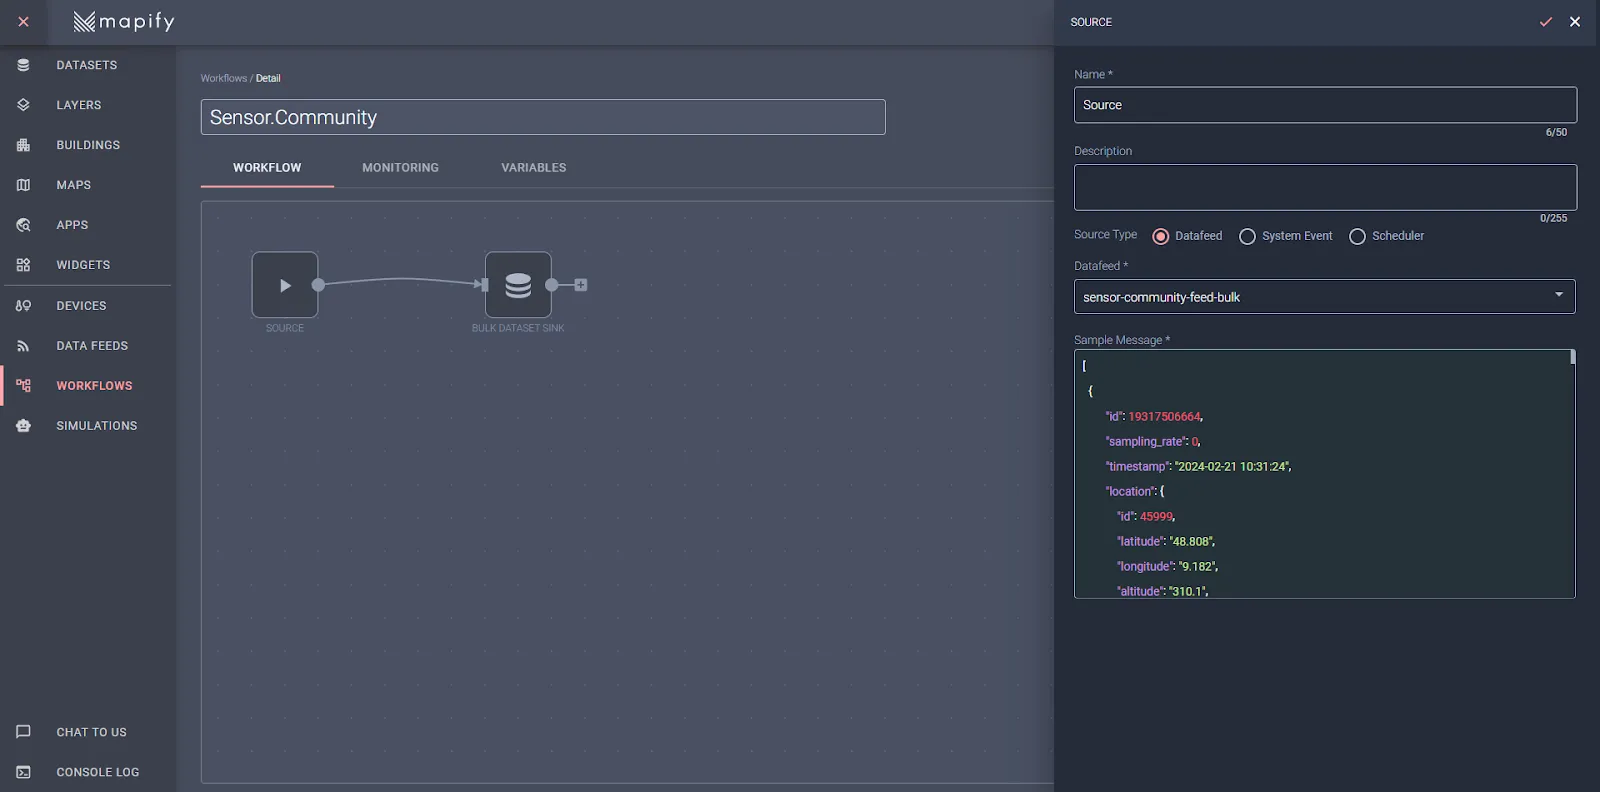
3. Create a Workflow to process the incoming sensor data
In order to process the incoming data, you’ll need to create at least one workflow. We’ll create a workflow to save the incoming data to the Dataset you created in a previous step.
Create a new Workflow, and select the previously created Data Feed in its source node.
Connect a new Bulk update Dataset sink node to the source node, and map all the necessary message fields to the dataset fields. Make sure the “Remove existing data” checkbox is enabled so that existing outdated data is replaced with newly obtained data.
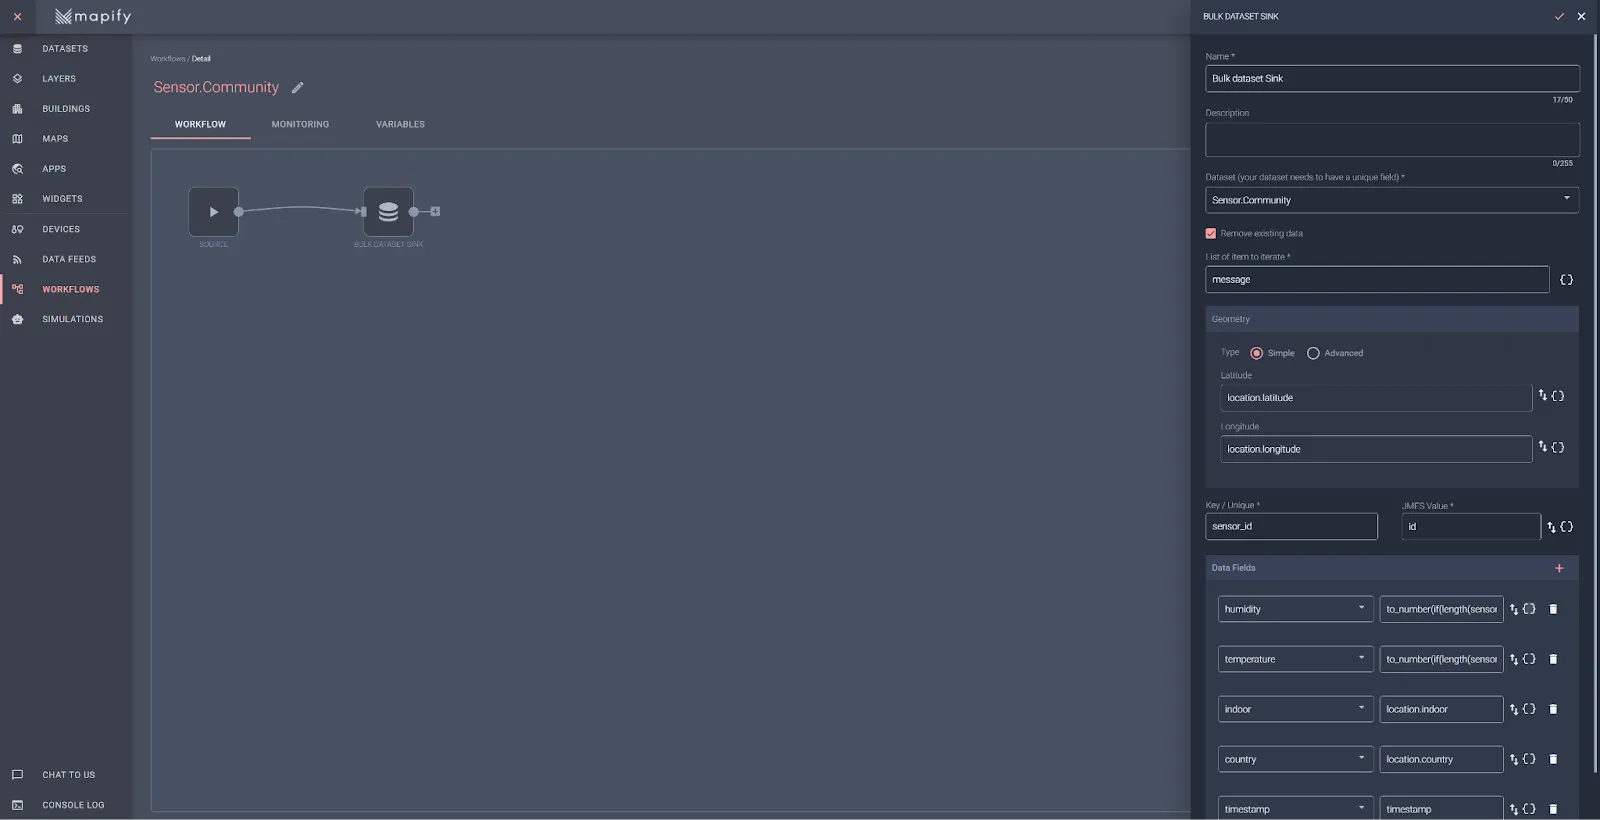
You can refine your workflow by adding additional nodes that perform additional verifications, or you can integrate with third-party systems by using nodes which send data to an external data lake such as Google’s Big Query, or which invoke external HTTP APIs, as just a couple of examples of what is possible to create using Mapify.
4. Create Layers to render your data over a map
Since this article focus is a quick and simple example of how to process and display your data in real time, you’ll create a Layer to render your data. You can later create more layers from your data, each with its specific styling and/or data filters.
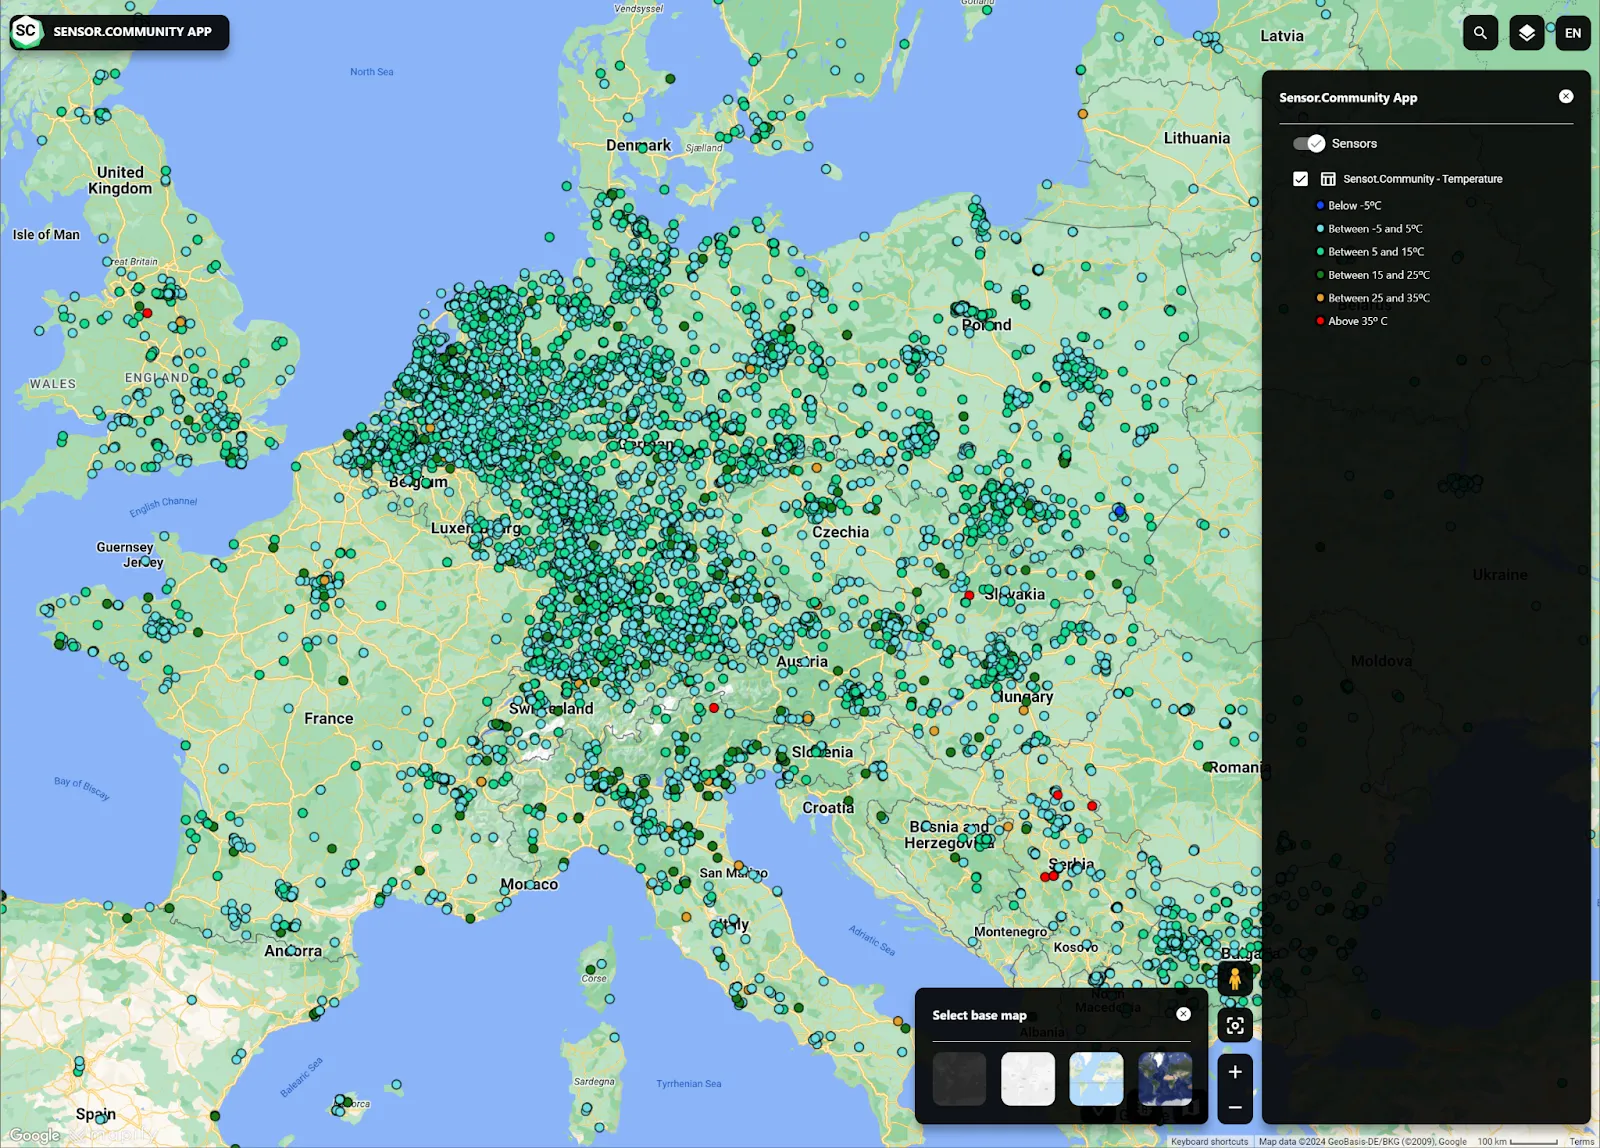
For our example, we will create a Layer that will render the sensors on a map, styling them according to their temperature value.
Create a new Real Time layer, select the previously created Dataset as its underlying data source. After that, in the Style tab, define your style according to the value of the “temperature” field. Its configuration should look similar to the illustration below:
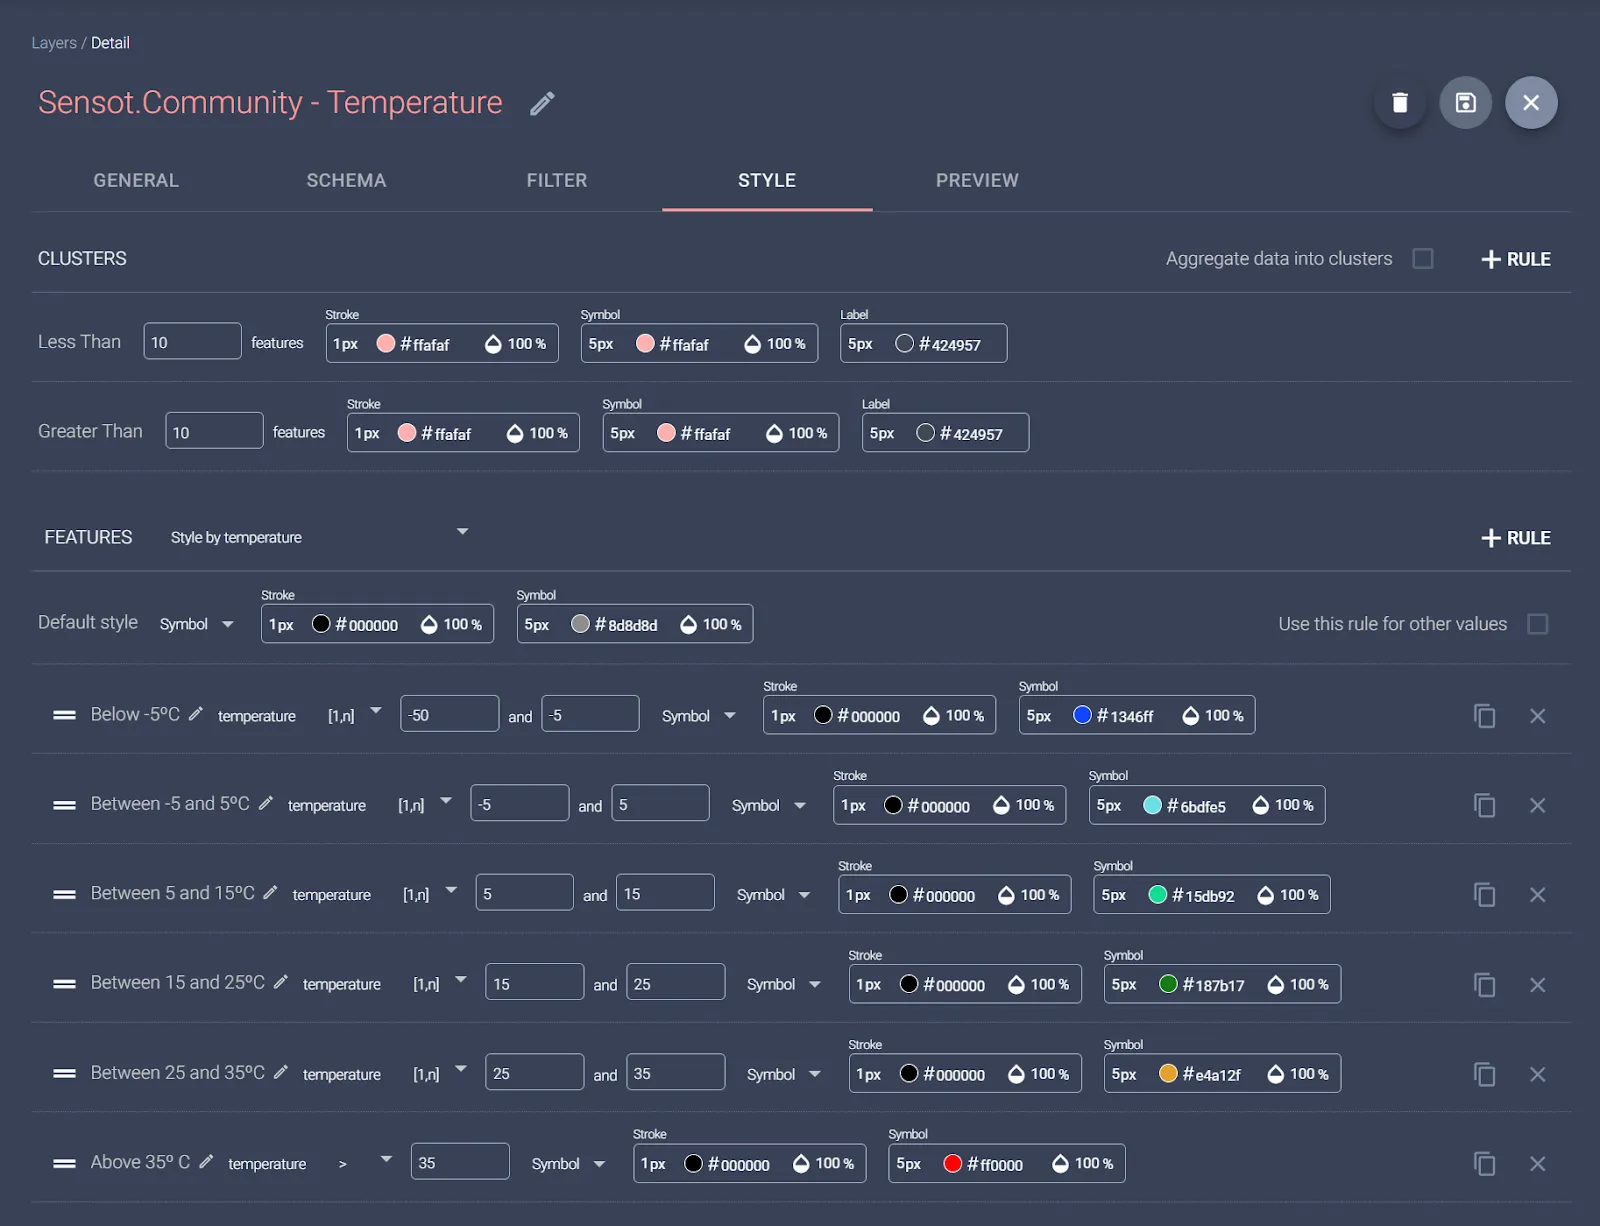
Click the preview tab, and you should be able to see the sensor data already styled according to the style you defined.
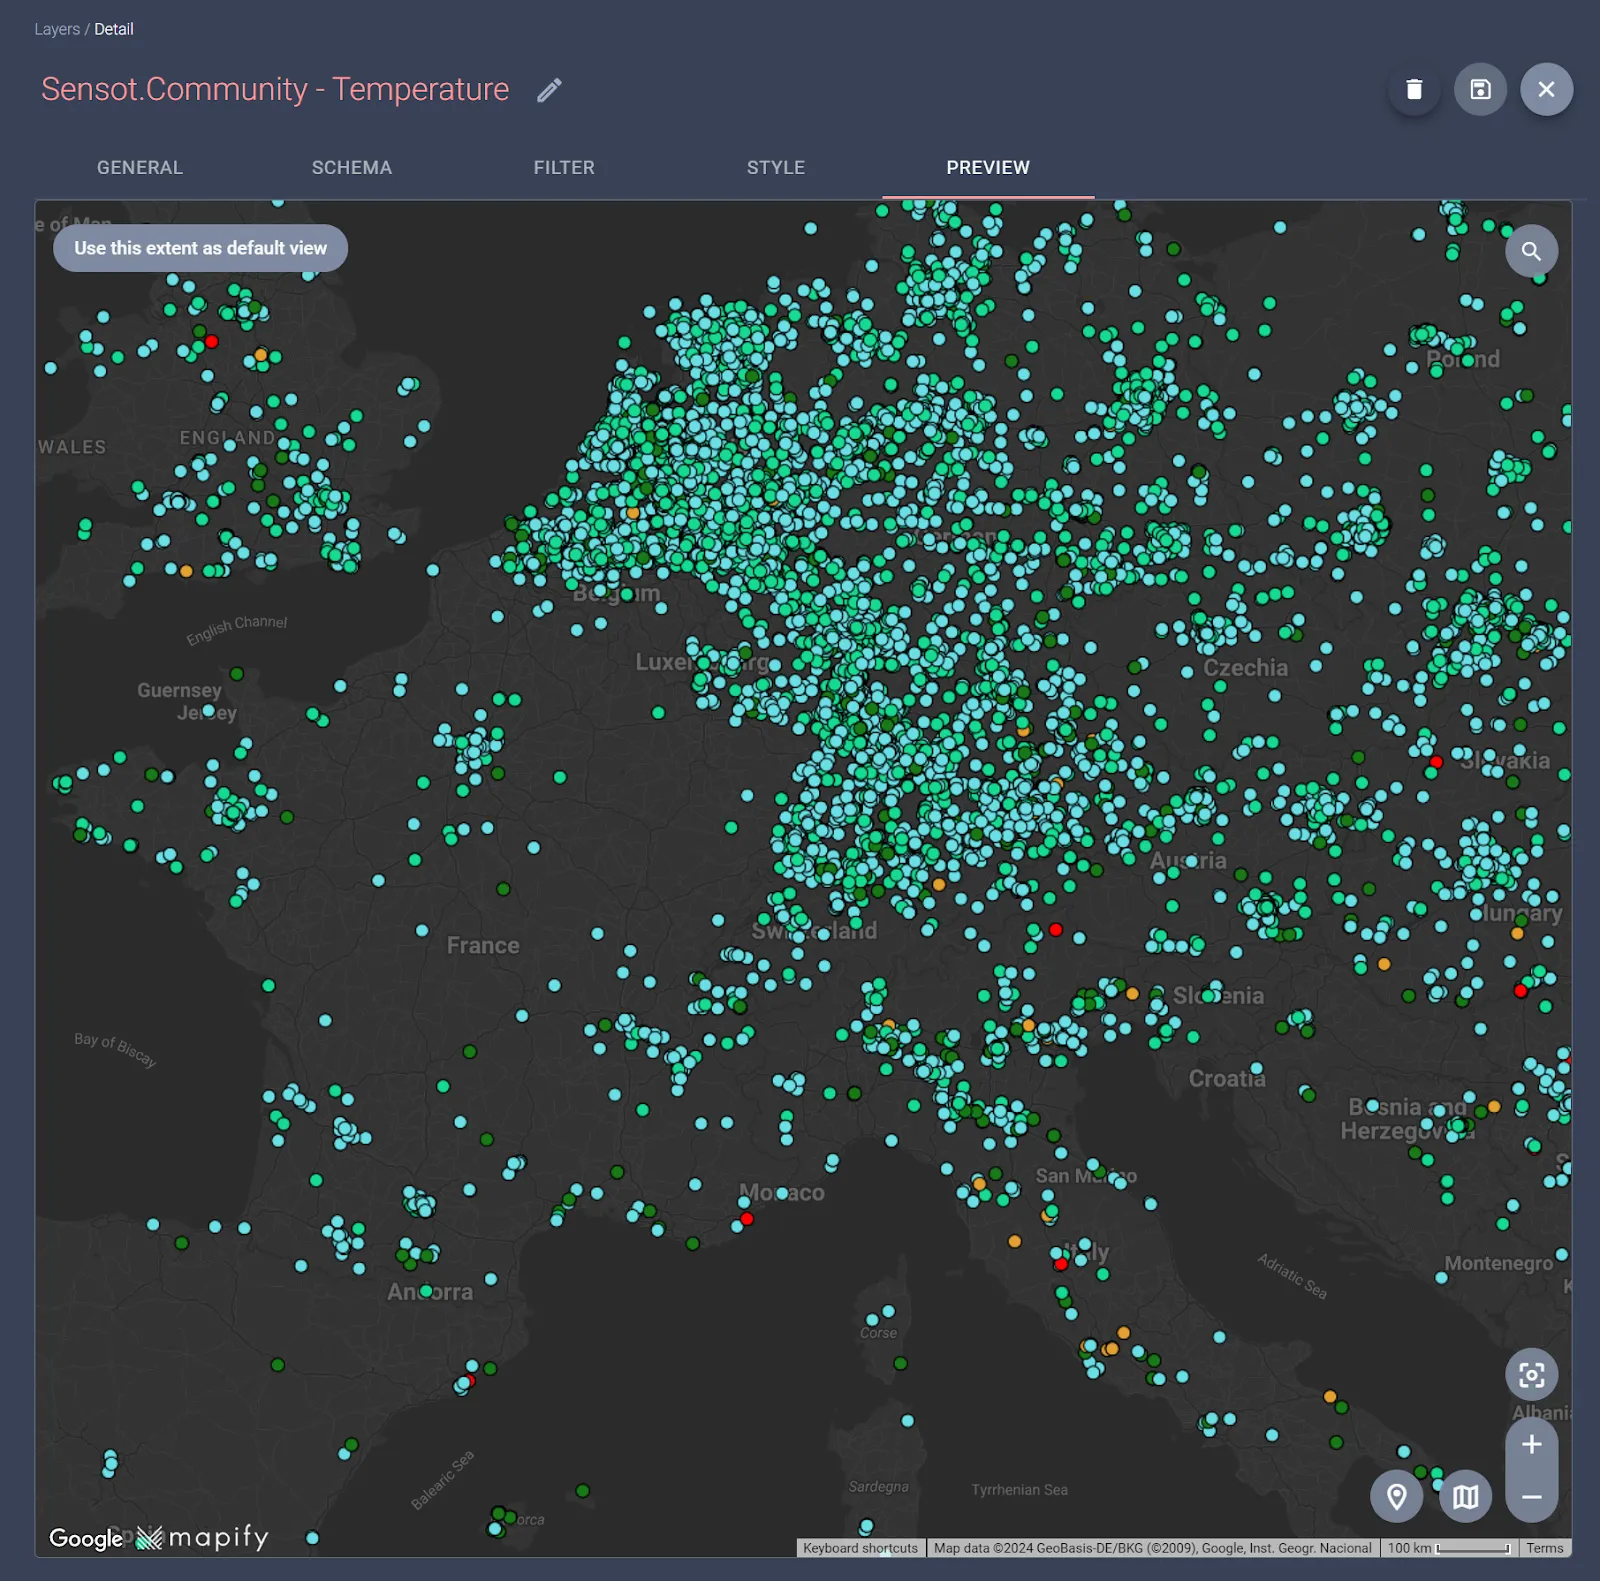
Since the data is being automatically updated by the Workflow every 5 minutes, your layer will also reflect the latest available data.
5. Create a Map and share it through a No-Code App
For you to be able to share a web application link that displays your data, you will need to create a Map and then a Mapify App to share it.
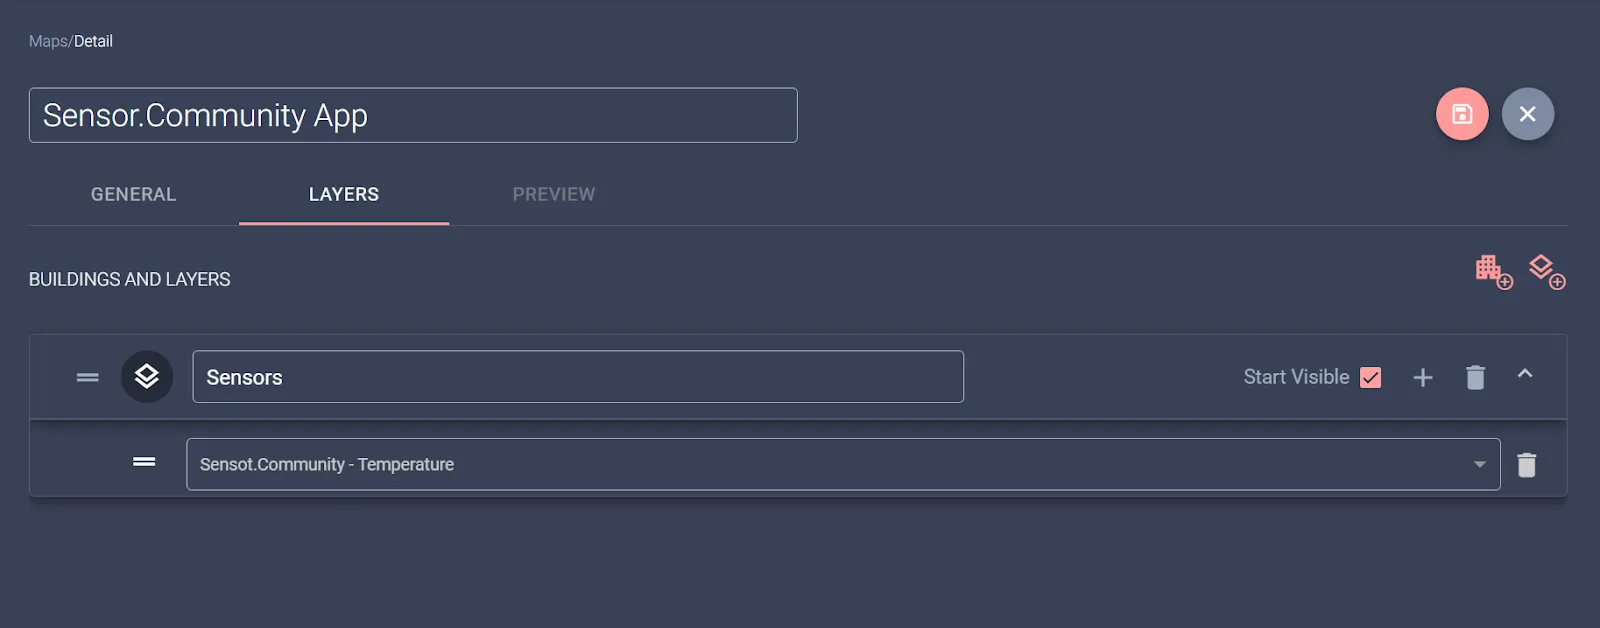
Creating a Map is as easy as specifying layer groups, adding layers to the respective group(s), and ordering them as you want. In our example, since we only have one layer, we create a simple Map with a “Sensors” layers group and add to it the previously created layer.
After saving your new Map, you should be able to preview the result, including the automatically generated legend based on your layer style configuration:
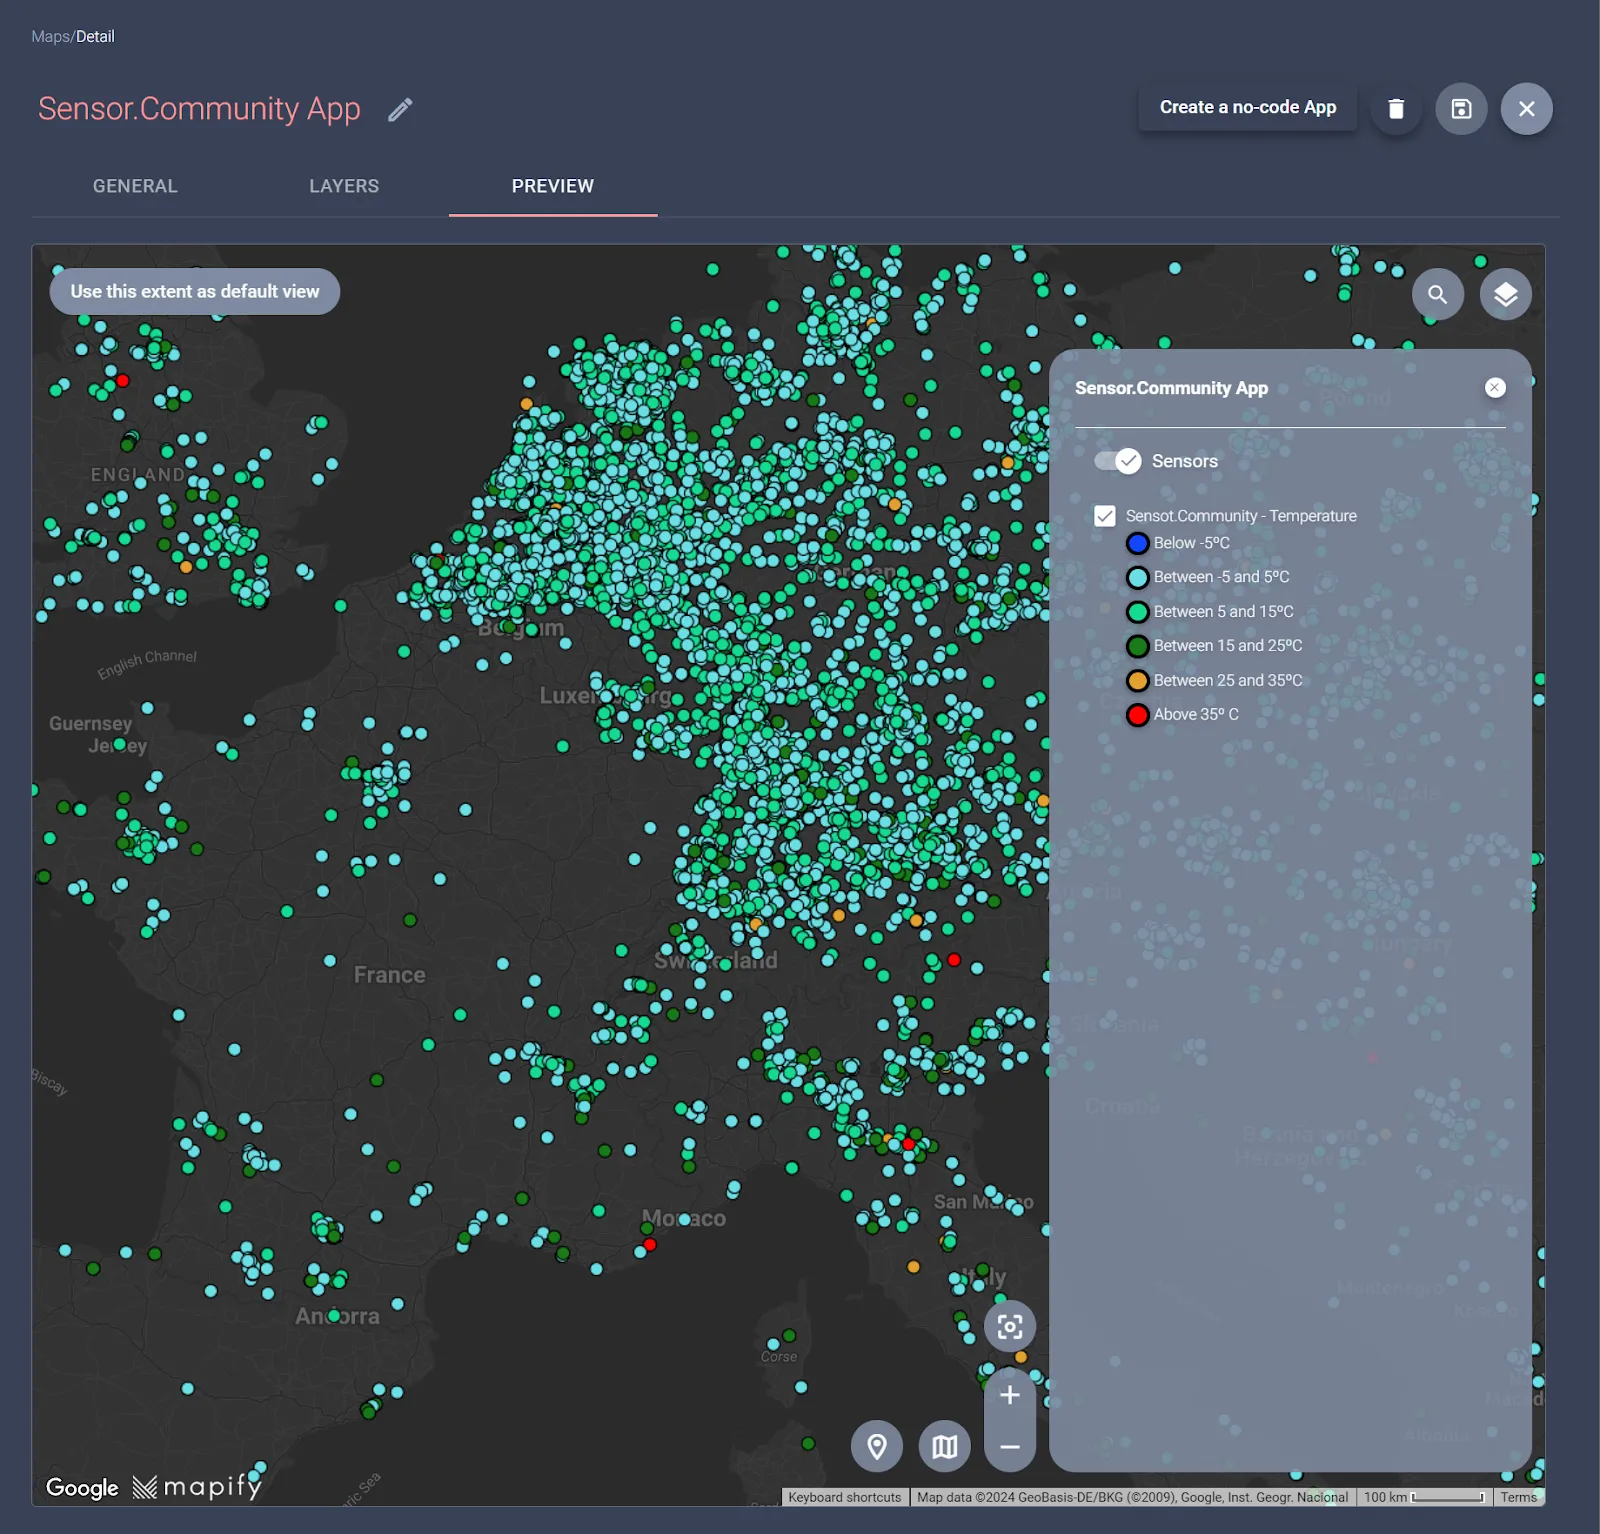
The final step is to click on the “Create a no-code App” button, which will automatically create a no-code web application with the selected map. Set it according to your needs, changing its colors and icons, and be sure to select all the controls from the “Controls” tab (maybe except the Welcome popup).
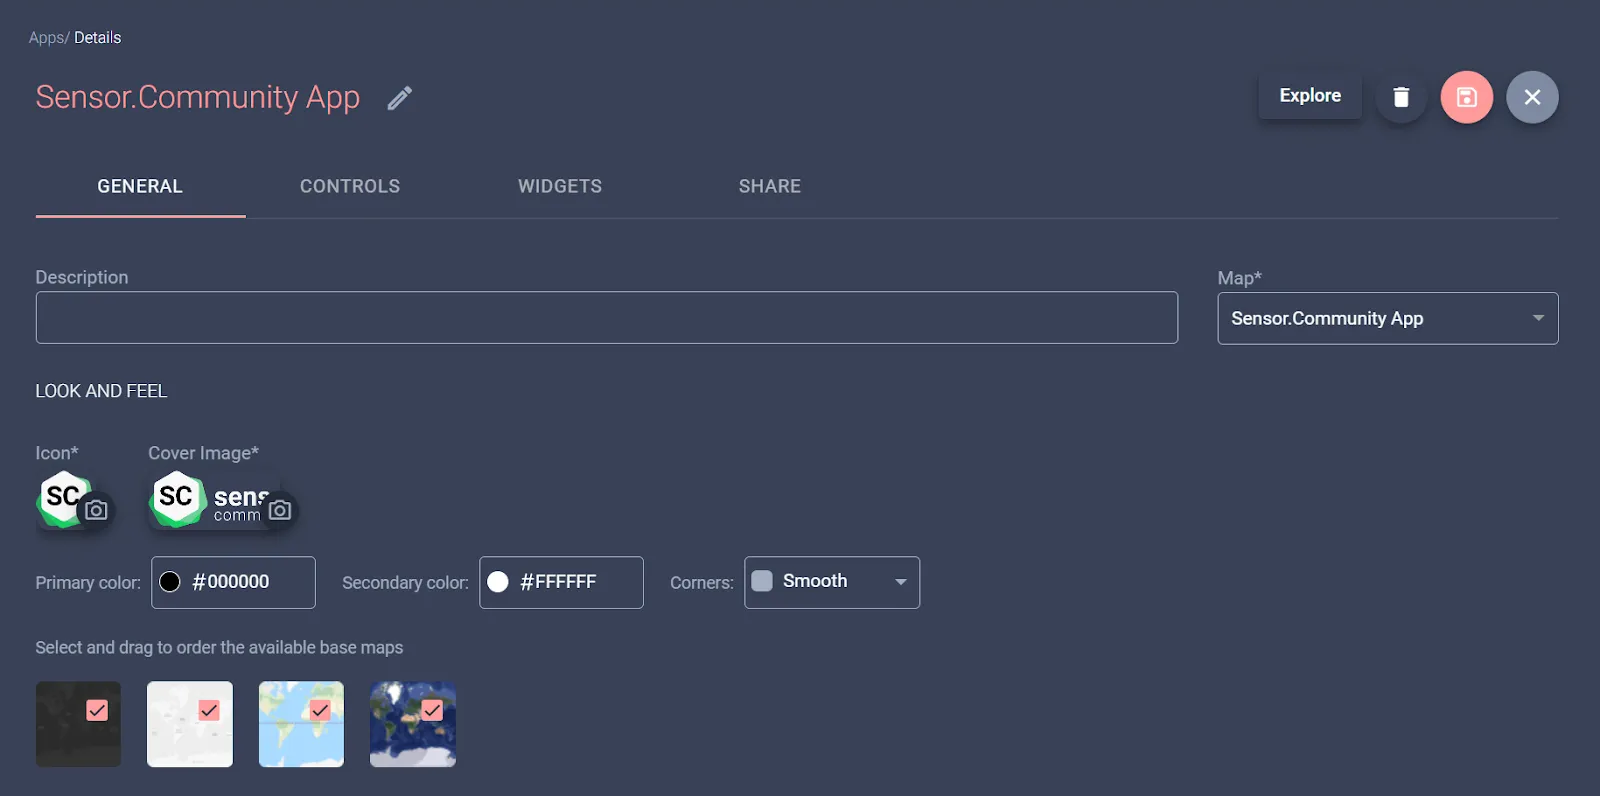
After you save your new app, you should be able to explore it by clicking on the “Explore” button or sharing it through the “Share” tab.
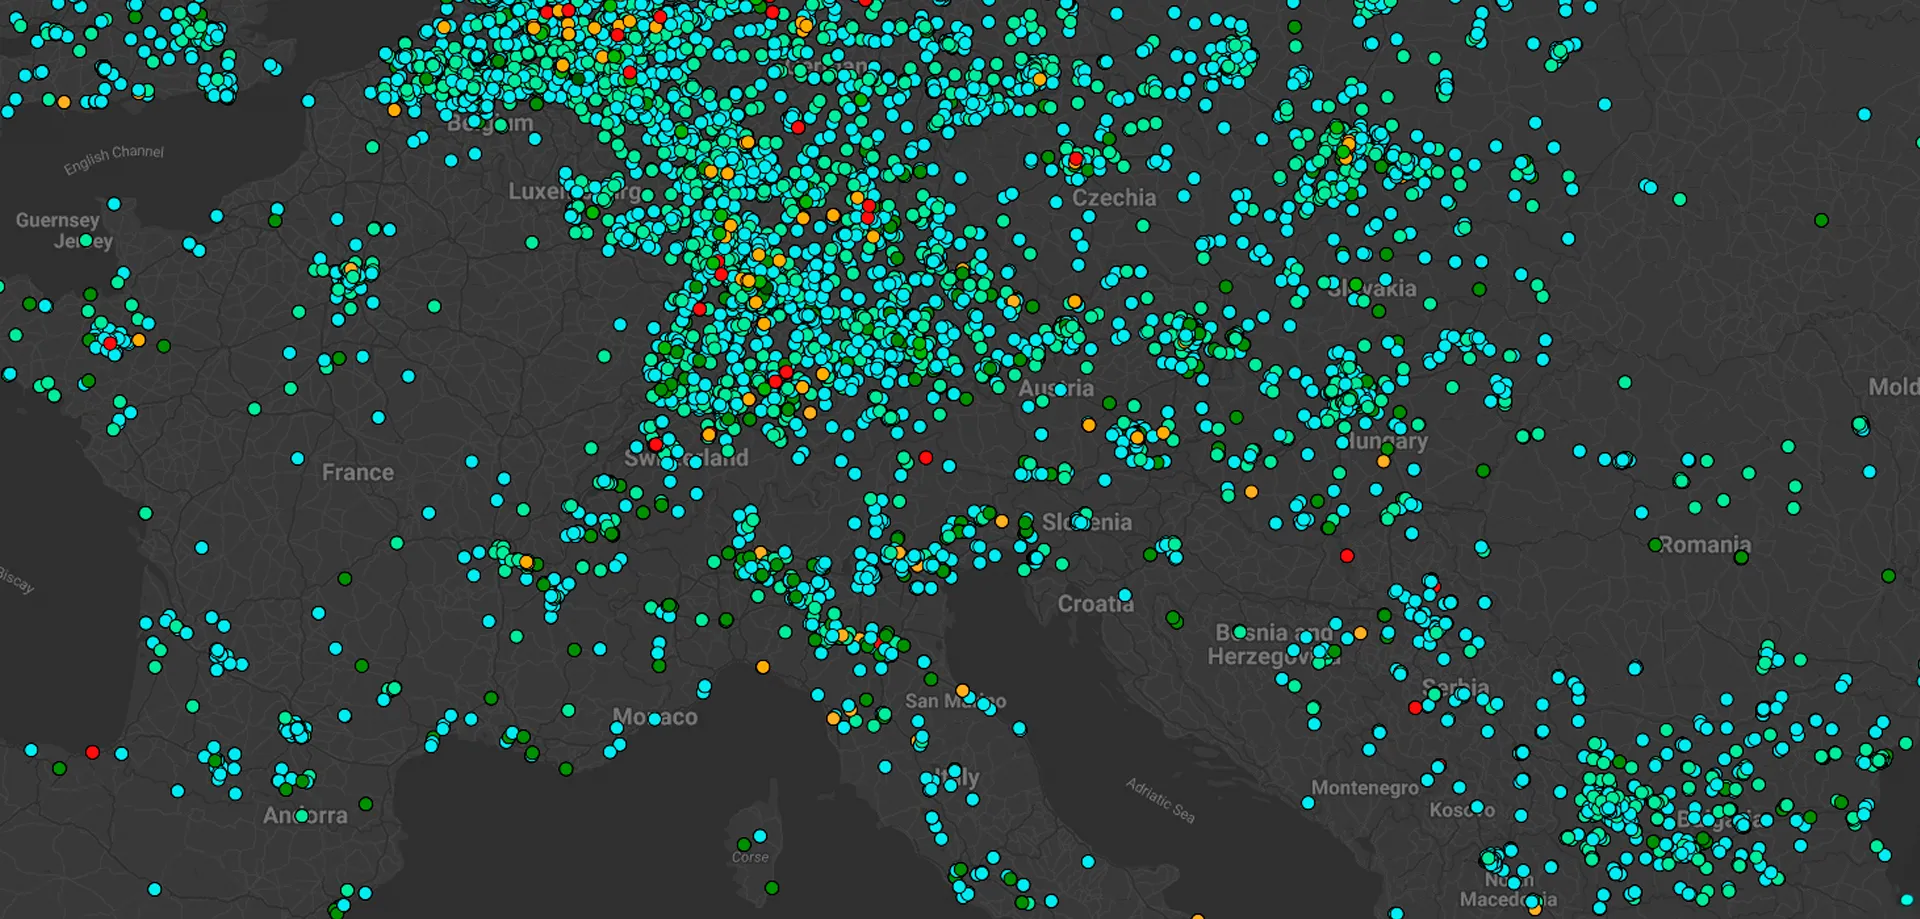
With some additional work in the layers, workflows, and widgets, you can quickly and easily create amazing solutions that leverage your business rules and can integrate with your existing systems. You would achieve something like this 👇 without having to code.
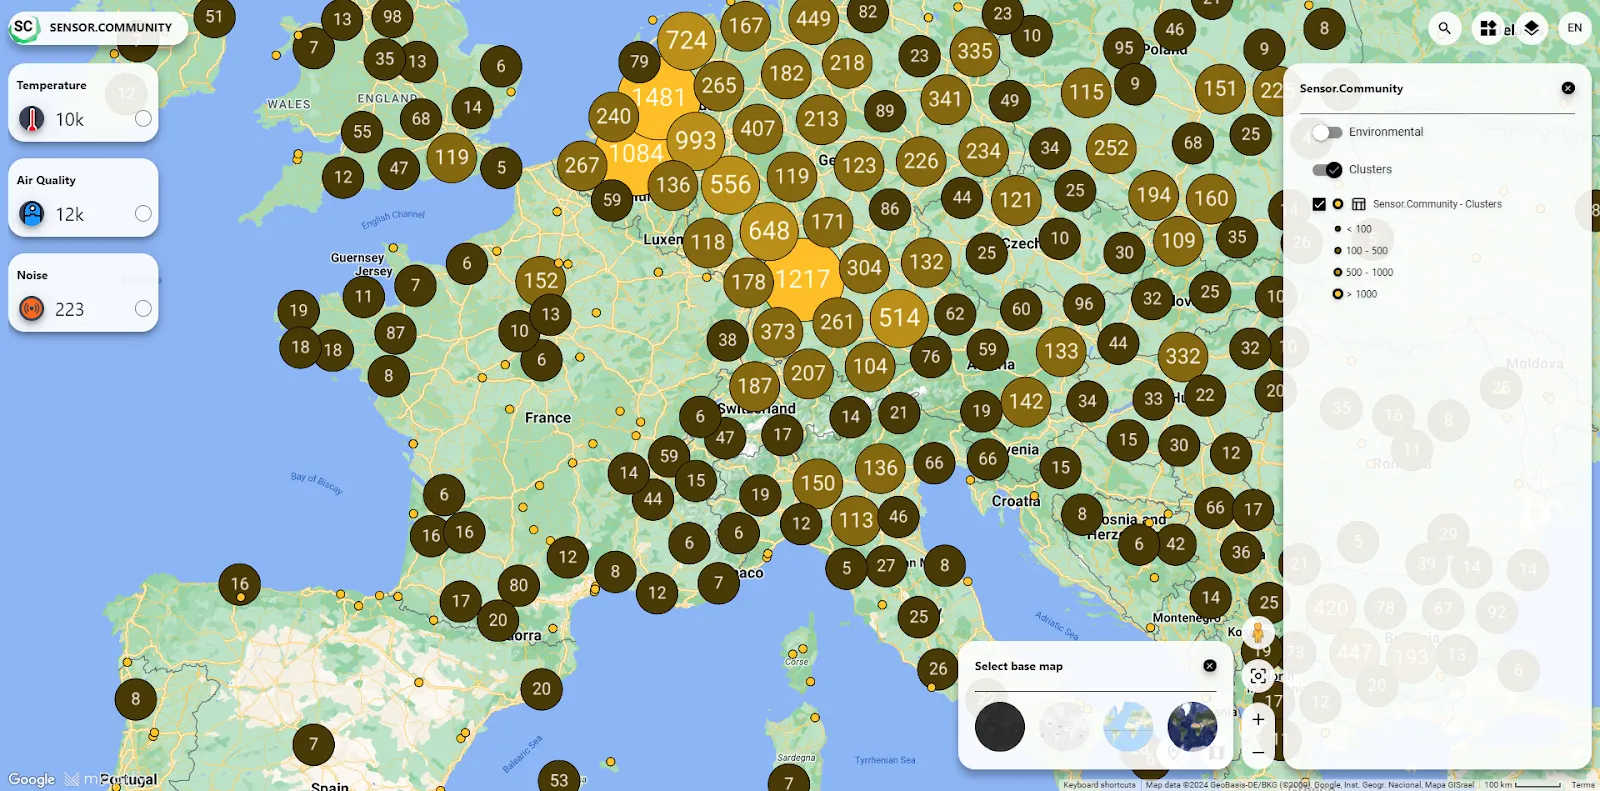
Feel free to play around with this interactive Sensor.Community data map.
Mapify and sensor data 🤝a match made in heaven.
Do you want to replicate this step-by-step guide or perhaps display your own sensor data? Enjoy our free trial here!

.jpg)

.webp)
.webp)
