Customise Mapify Layers with Data Filters
November 3, 2022
Mário Sobral
Layers are important views to your data, make sure each of them conveys relevant information. Your data can be very accurate and timely, but it is as important for you to correctly convey the underlying information to your users in the simplest and most impactful way.
Mapify allows you to define which data is shown in each of your layers regardless of the full data available in the associated Dataset.
If you want to dive right in the deep end, feel free to request a Mapify trial here, or click here to schedule a talk with us.
A Data Filter is a JSON based structure used to define which Dataset records will be used in a Layer based on that Dataset.
It could be said it is the Mapify equivalent of a relational database query definition for a view, in the way a Data Filter defines which data is returned to be used in a Layer.
This also means that from a single Dataset containing a full set of data, you can create several layers, each representing a subset of that data that may be relevant on itself.
So let’s walk through an example, to better illustrate how to use Data Filters in Mapify. For this example, we’ll import a freely available World Populated Places shapefile from Natural Earth to a new Mapify Dataset.
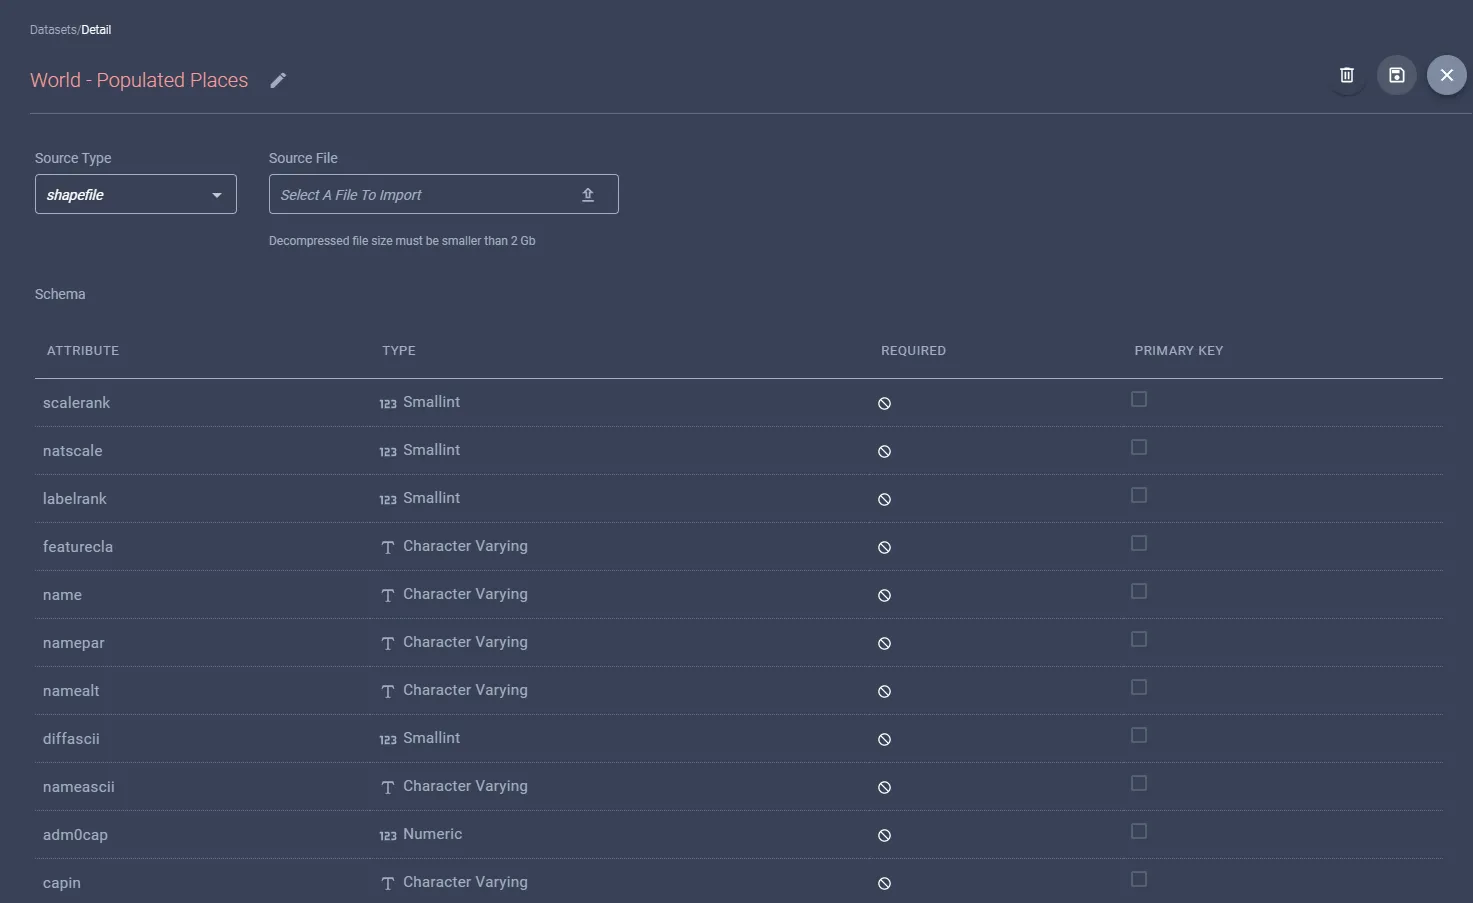
This Dataset contains a large number of attributes, but we’ll focus on the pop_max attribute, which represents the maximum population number for that city.
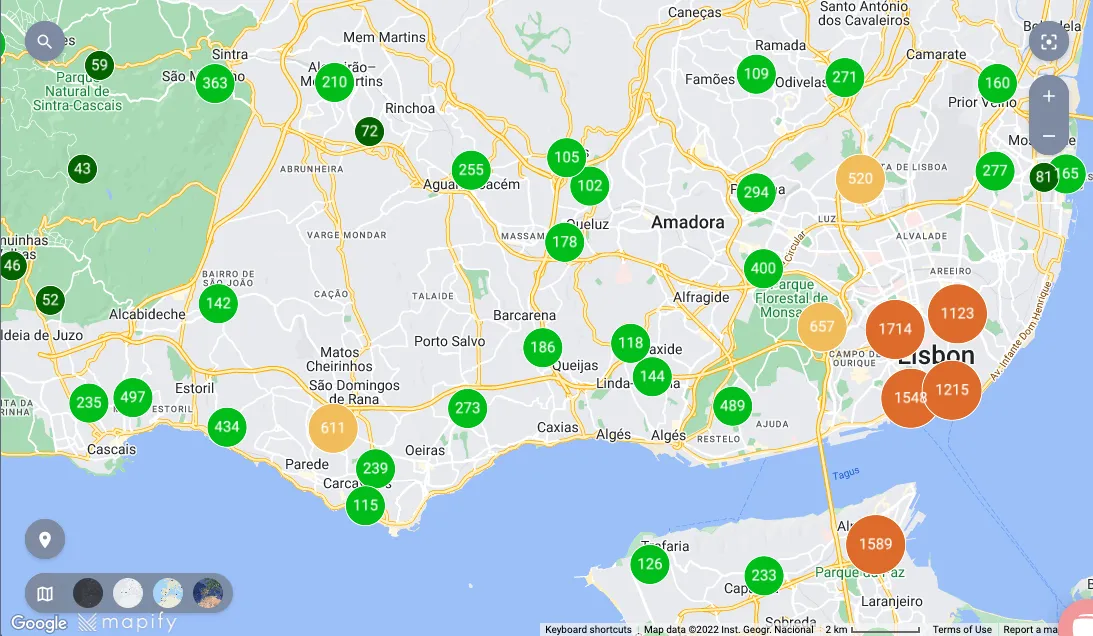
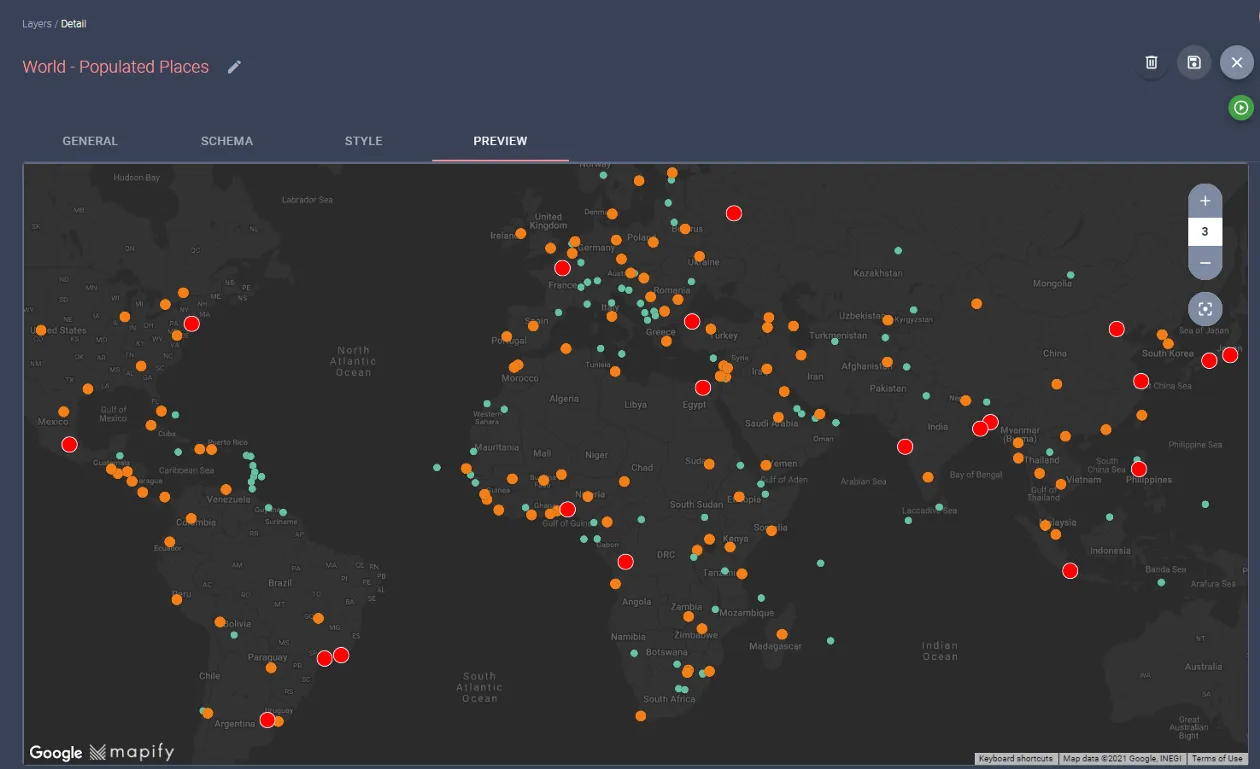
Let’s create a layer based on the above World Populated Place derived dataset, and style it using the pop_max attribute. I have setup three different styles using the layer styling By Attribute, for locations with maximum population values:
- below 1 million
- between 1 million and 10 million
- greater than 10 million
This is how it may look, if you define as larger sized red circles for the greater than 10 million population locations:
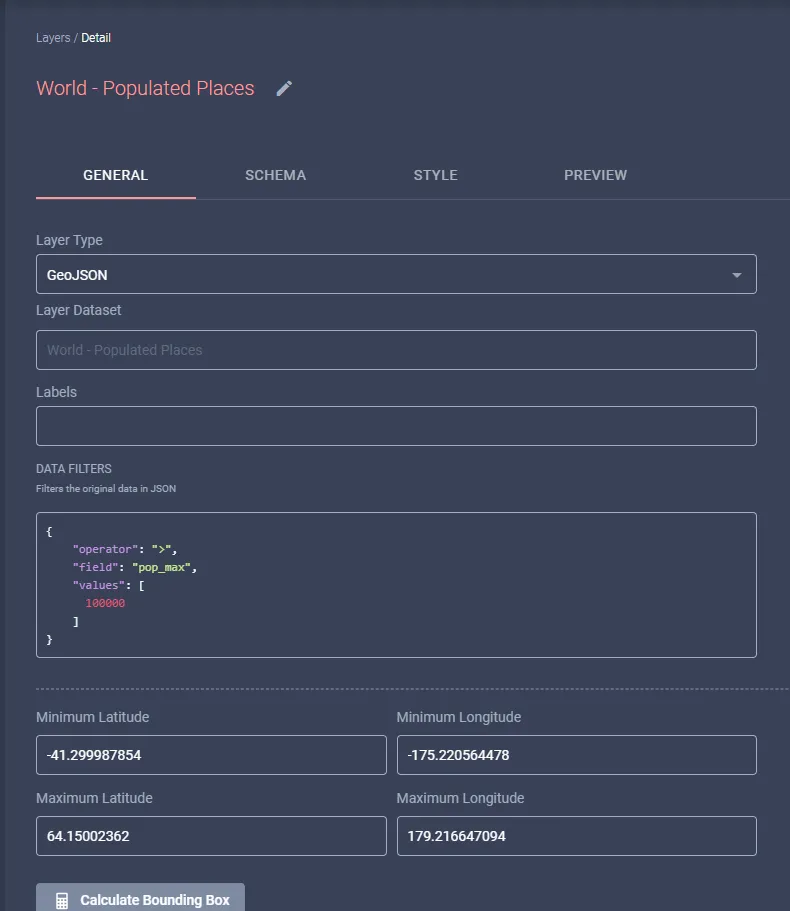
Now, let’s assume we needed this layer to only retrieve and display locations with maximum population greater than 10 million. To achieve that, we would need to define a Data Filter such as:
{
"operator": ">",
"field": "pop_max",
"values": [
10000000
]
}
So, in the General tab of the layer, we would type that Data Filter in the Data Filters input box:
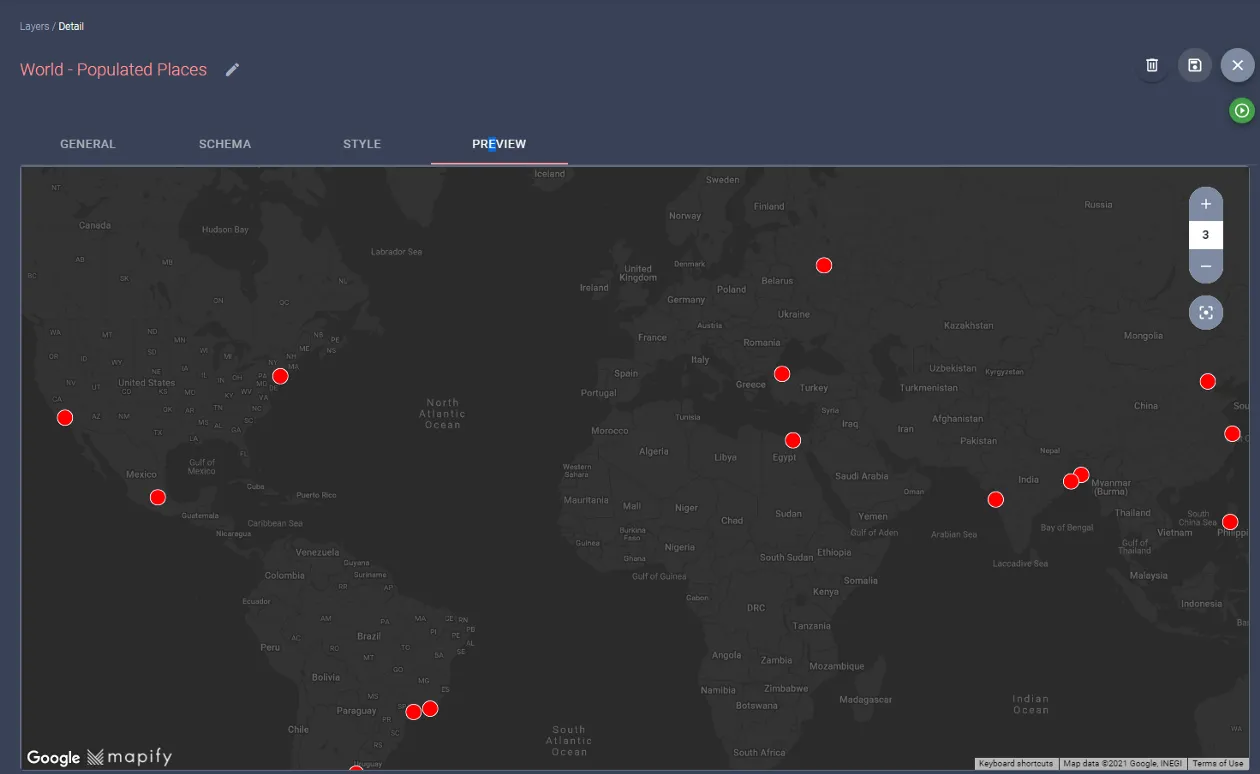
After saving the changes to the layer, you need to re-publish it again. And once the layer is finished re-publishing, you will notice how the Layer now only obtains and renders data for locations with maximum population greater than 10 million:
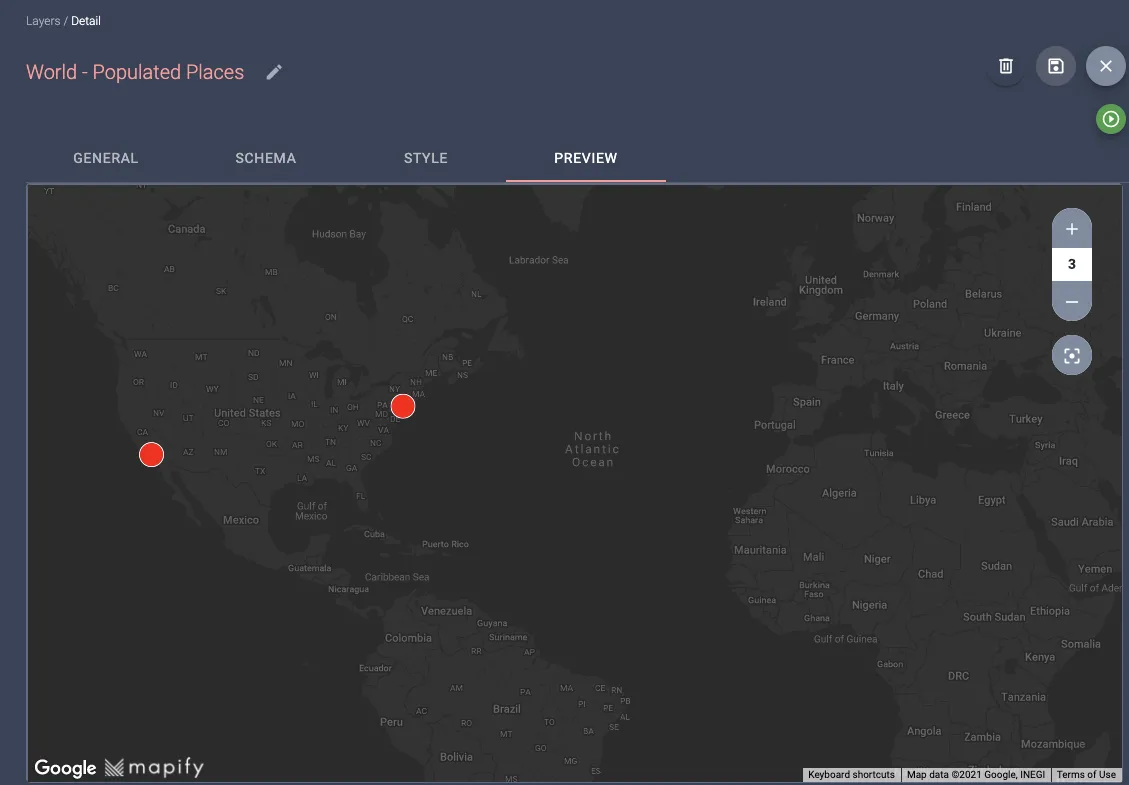
Now let’s assume we are only interested in those places which are located in the continental USA. We can add an additional filter with an AND operator to intersect a simplified GeoJSON representation of the continental USA:
{
"operator": "AND",
"filters": [
{
"operator": ">",
"field": "pop_max",
"values": [
10000000
]
},
{
"operator": "INTERSECTS",
"values": [
{
"type": "Polygon",
"coordinates": [
[
[
-125.15625000000001,
47.517200697839414
],
[
-124.1015625,
31.353636941500987
],
[
-80.5078125,
25.16517336866393
],
[
-62.57812500000001,
46.07323062540835
],
[
-100.8984375,
49.38237278700955
],
[
-125.5078125,
49.15296965617042
],
[
-125.15625000000001,
47.517200697839414
]
]
]
}
]
}
]
}
Save your layer with the updated data filter, and re-publish the layer.
Once the layer has been re-published, you should see the resulting layer features in the preview tab, similar to the screenshot below:
Data Filters are a powerful way to customise your layers and allow you to provide different sets of visualisations from the same set of raw data in a Dataset.
I hope you enjoyed this walkthrough and can now see the amazing and powerful role of Data Filters in Mapify!
Ready to power your solutions with Mapify ? Feel free to request a Mapify trial here, or click here to schedule a talk with us and we’ll show you what Mapify can do for you and your business.