Mapify has a lot to offer to smart cities
October 11, 2022
Mário Sobral

If you build solutions for smart cities, you most certainly know that recent global events such as COVID-19 and the war in Ukraine have put cities under pressure. Ranging from smart mobility to sustainability, from healthcare response to logistics, these challenges from a city's perspective can be boiled down to: how can cities react quickly and in an organized manner to the changes in their citizens' life.
Cities are looking for new technologies and disruptive solutions that can handle tons of real-time data points that can contribute to the decision process. This has put the Internet of Things (IoT) front and centre, with sensors being used across all the city's domains and requiring solutions to take into account not only their data but also their location. Well, Mapify is here to help you!
Mapify is a solid and powerful cloud-based platform which can help you build your IoT solution in hours, not days, without worrying about scalability and infrastructure. Mapify provides the tools and processing power to handle and process large volumes of static or real-time location data.
You can start by building an MVP using a no-code approach, drag-and-drop workflows and our automatically generated shareable web applications. Since Mapify is built using an API-first approach, you can still keep complete control over your processes and can keep evolving your solution through the use of our API and SDKs.

Below are some ideas on how you could build great solutions using Mapify with minimal effort, most of which require no code at all!
Categorizing buildings
Let's start with something simple, such as displaying large quantities of data on a map, and styling it dynamically according to your business rules.
The city of New York provides an excellent open data portal from which a large number of datasets can be obtained. One of those datasets contains the footprint outlines of all buildings in New York City, a large dataset indeed.
One of Mapify's features is its ability to directly import data in the shapefile format. This allows you to download the buildings' footprints dataset from the NYC Open Data portal as a shapefile and then import it into Mapify in a very simple and easy process with just a few mouse clicks.
Once the dataset is uploaded to Mapify, you can create amazing visualizations using layers and styling them. Here are New York building footprints layer colored according to each building's number of floors.

Given the available metadata, changing the representation of New York buildings on the map is a simple styling game.

Real-time monitoring of road incidents
Another advantage of Mapify is that it can handle real-time data and lets you process it using drag-and-drop configurable workflows. You don't need to ask a team of developers to turn your business rules into computer code thanks to Mapify Workflows.
Let's use 511NY.org road incidents REST API to display real-time road incidents from all of New York state on a map. Sounds complicated, doesn't it? It really isn't, if you use Mapify. Configure a dataset to hold the data, a data feed to regularly request data to the road incidents API endpoint, and simply configure a workflow to save the data to your dataset. No code is needed, the data is updated automatically, and it just works!
Since you are using workflows, you can also create email alerts for specific events, add additional business rules, make requests to external platforms or even take advantage of the direct integration capabilities with our product City as a Platform. Or simply create a layer with a few clicks, style it a bit, and display it all in real-time on an interactive map on your website!

Smart mobility
👉 Do you want to let a user know which are the closest bike docking stations with free slots?
👉 Do you need to check the location of a fleet of city vehicles in real-time to direct them to emergency locations quickly?
👉 Do you need to determine the tariff to be applied to a specific vehicle based on its location and tariff zones?
Mapify has got you covered and you'll be surprised by how quickly and easily you can add those features to your solution using Mapify.
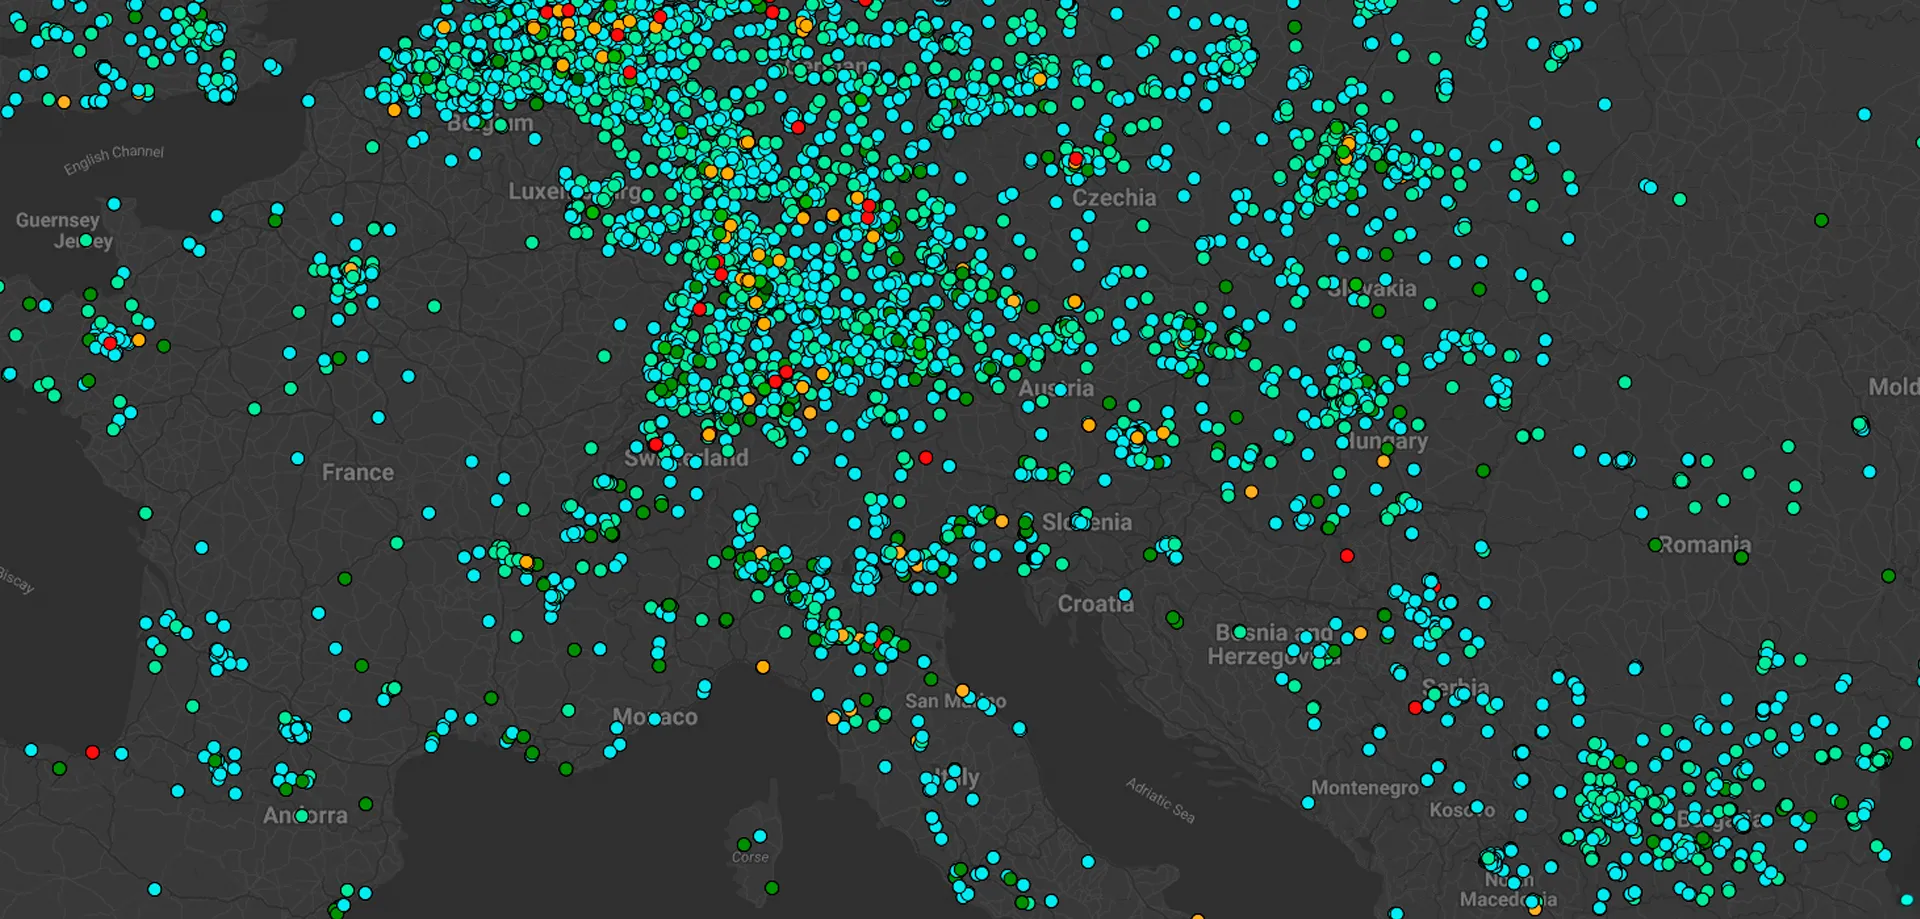
The city of Helsinki is a great example of a city's open data approach. They provide real-time public transportation data with its InfoShare service, but also promote and support initiatives such as Digitransit, an easy-to-access service platform provided by HSL, Fintraffic and TVV LMJ Oy.
Since Mapify directly supports subscribing to MQTT feeds, we simply create data feeds that subscribe to Digitransit's MQTT feeds for buses, trains, subways, and even ferries. We can use a workflow to update datasets with the incoming data and display it on real-time layers.

Everyone would pretty much agree that in cities, as in life, change is the only constant. With some imagination and little effort, Mapify can help you build the next generation of smart city solutions.
Ready to explore Mapify's capabilities? Request a Mapify trial, or schedule a talk with us and we’ll show you how we can make your life easier.
.jpg)
.webp)